How can I visualise complex ideas with simple forms?

How can I visualise complex ideas with simple forms?

My two cents

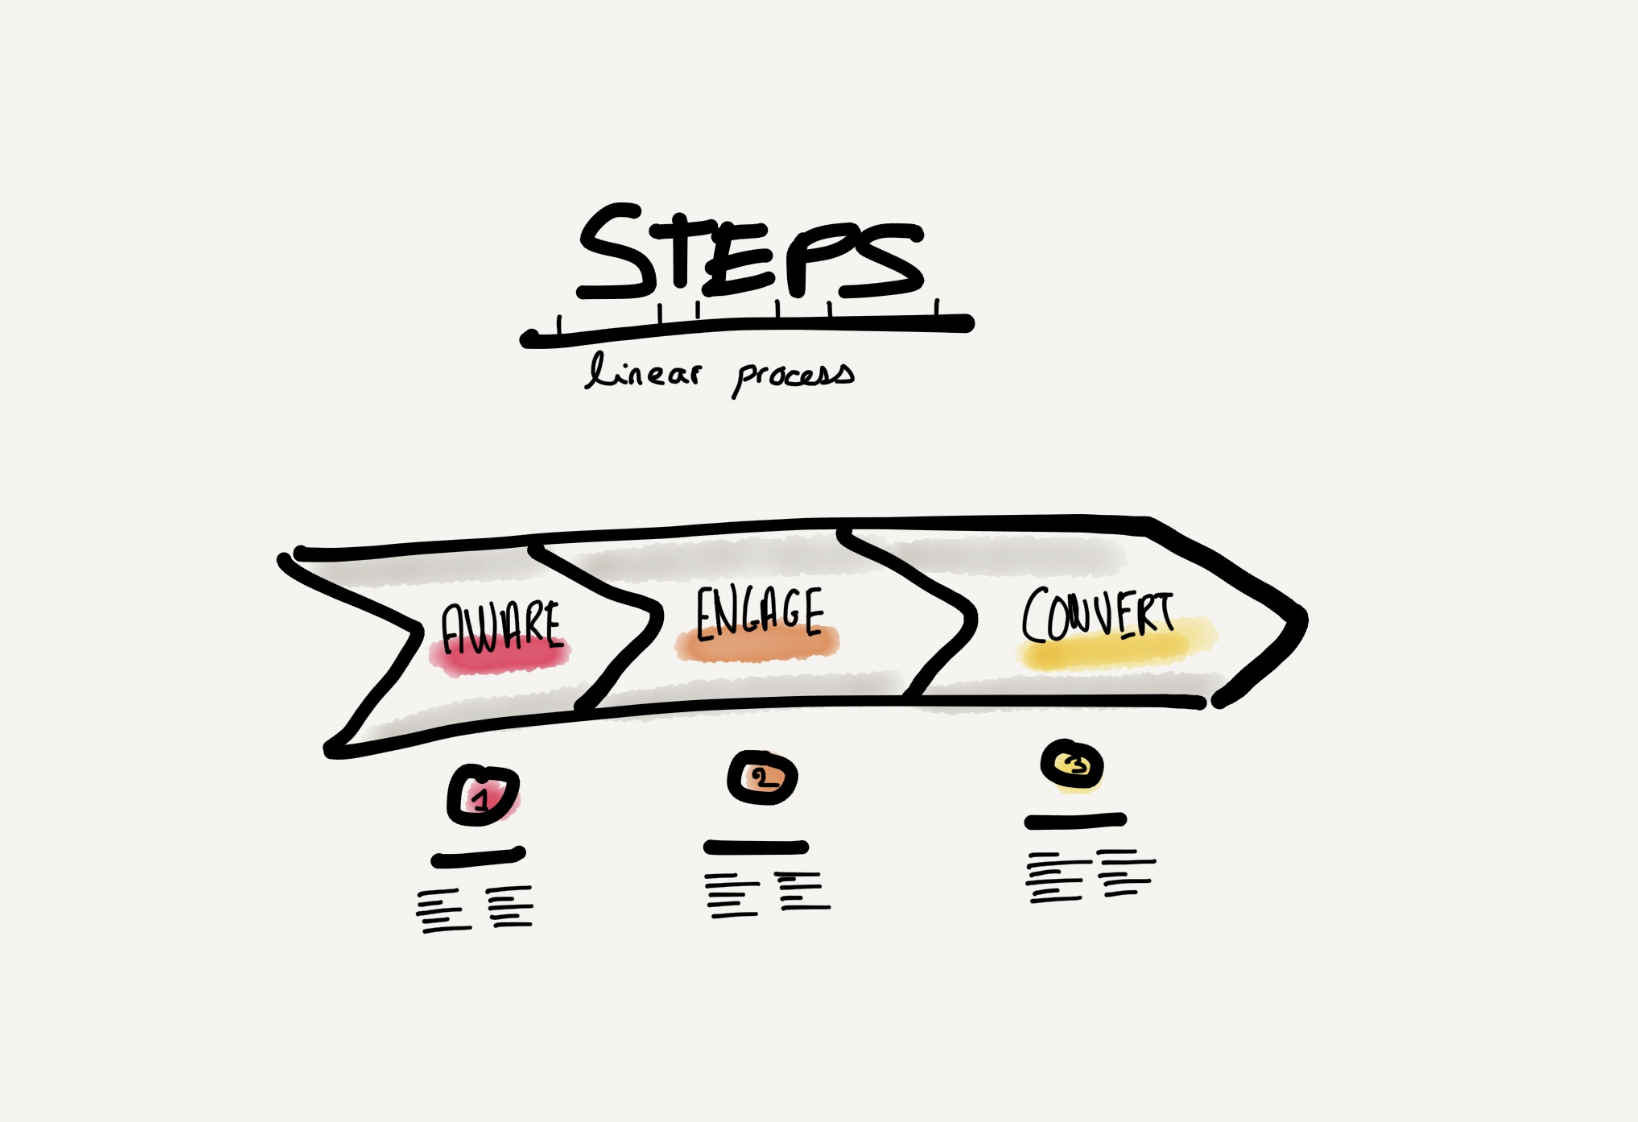
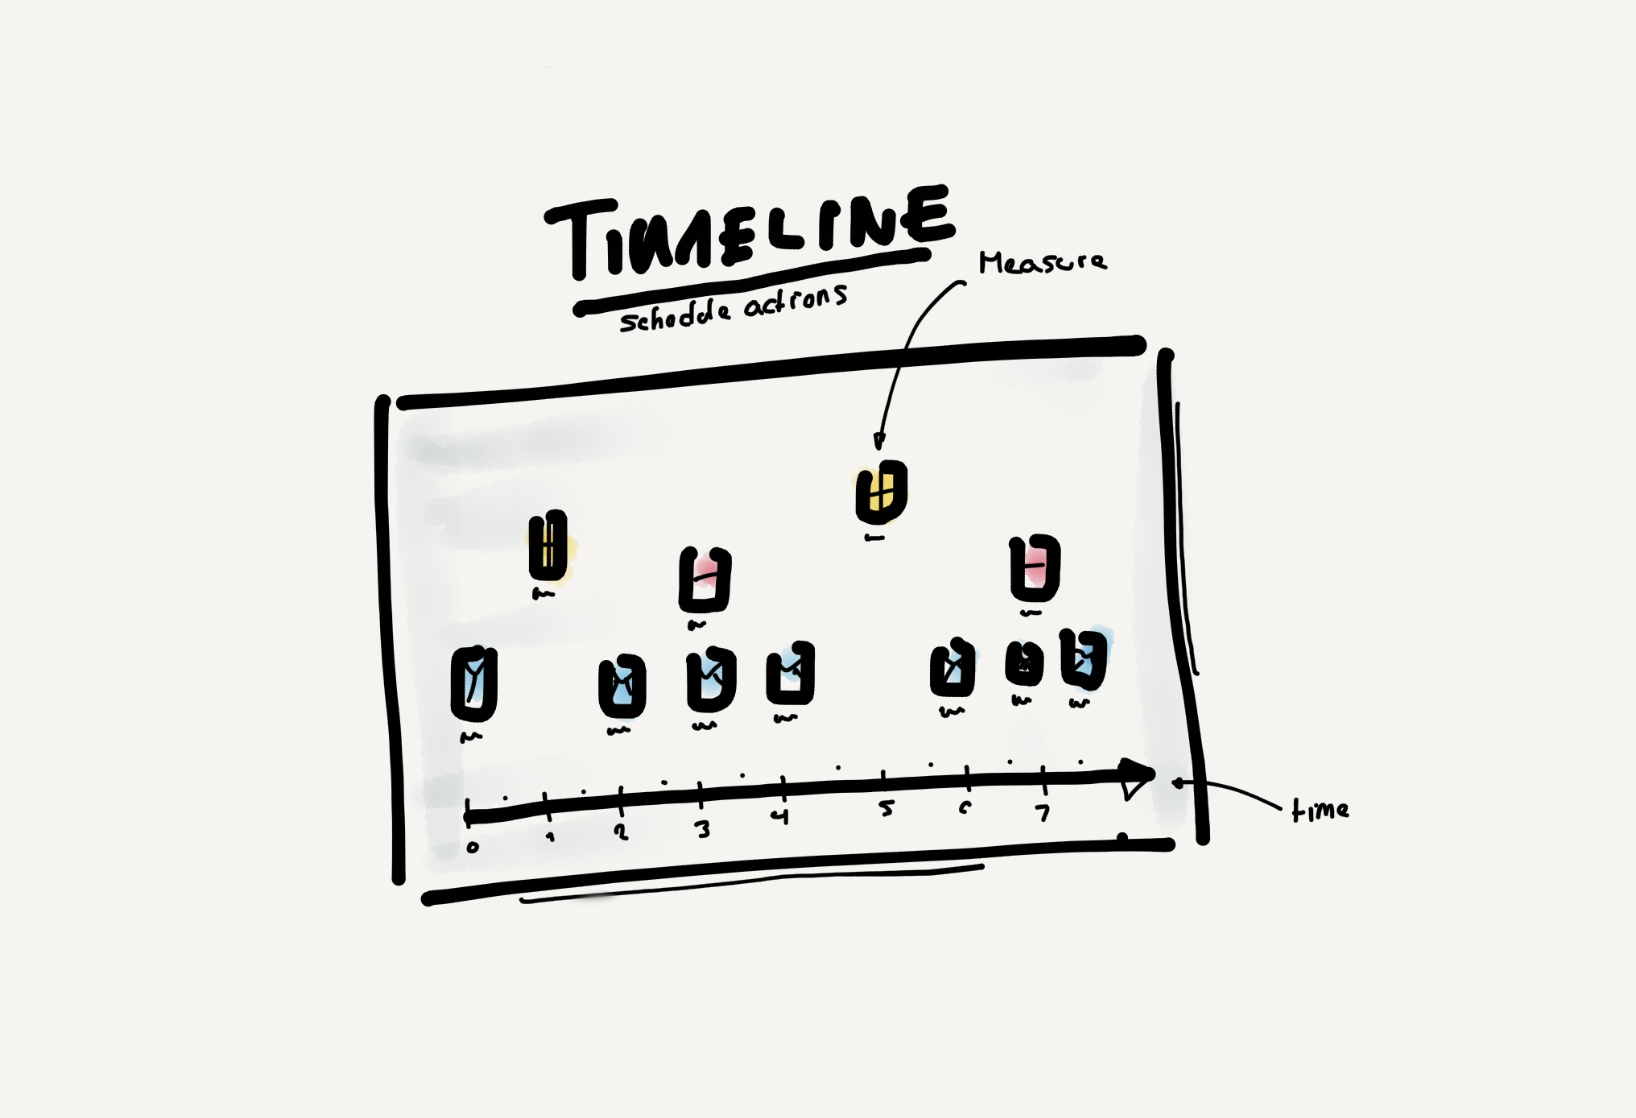
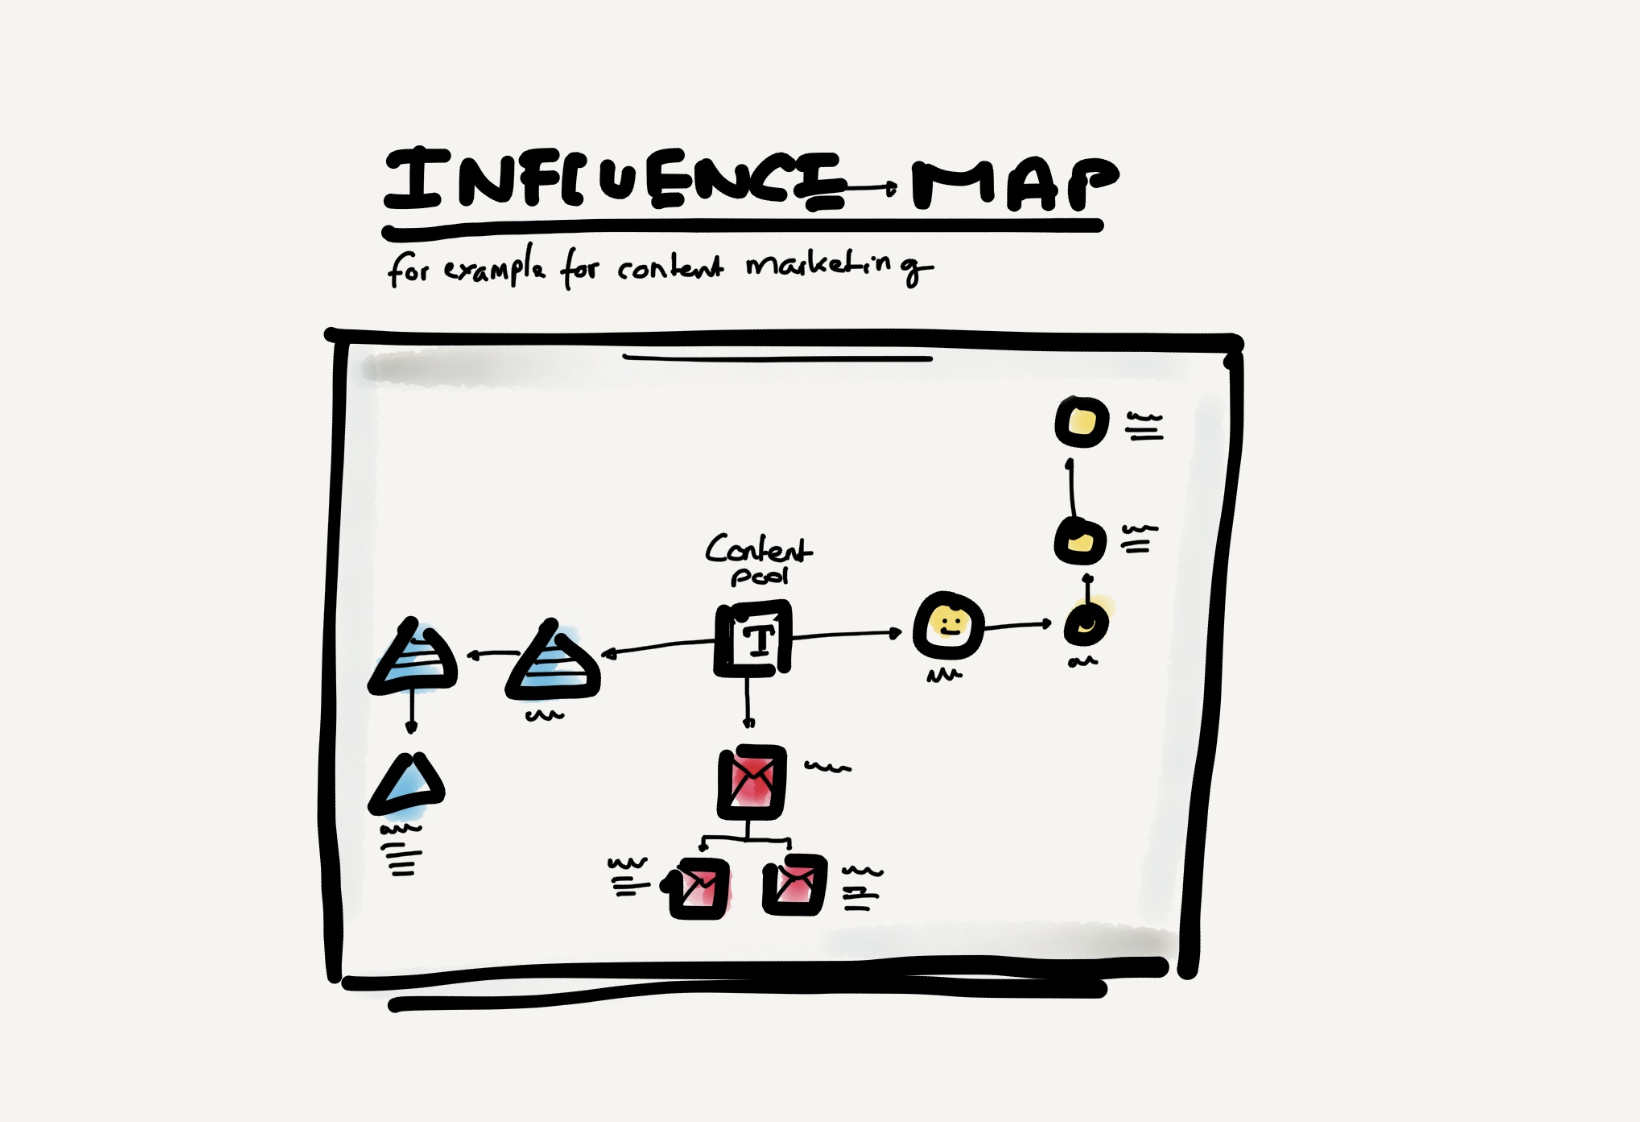
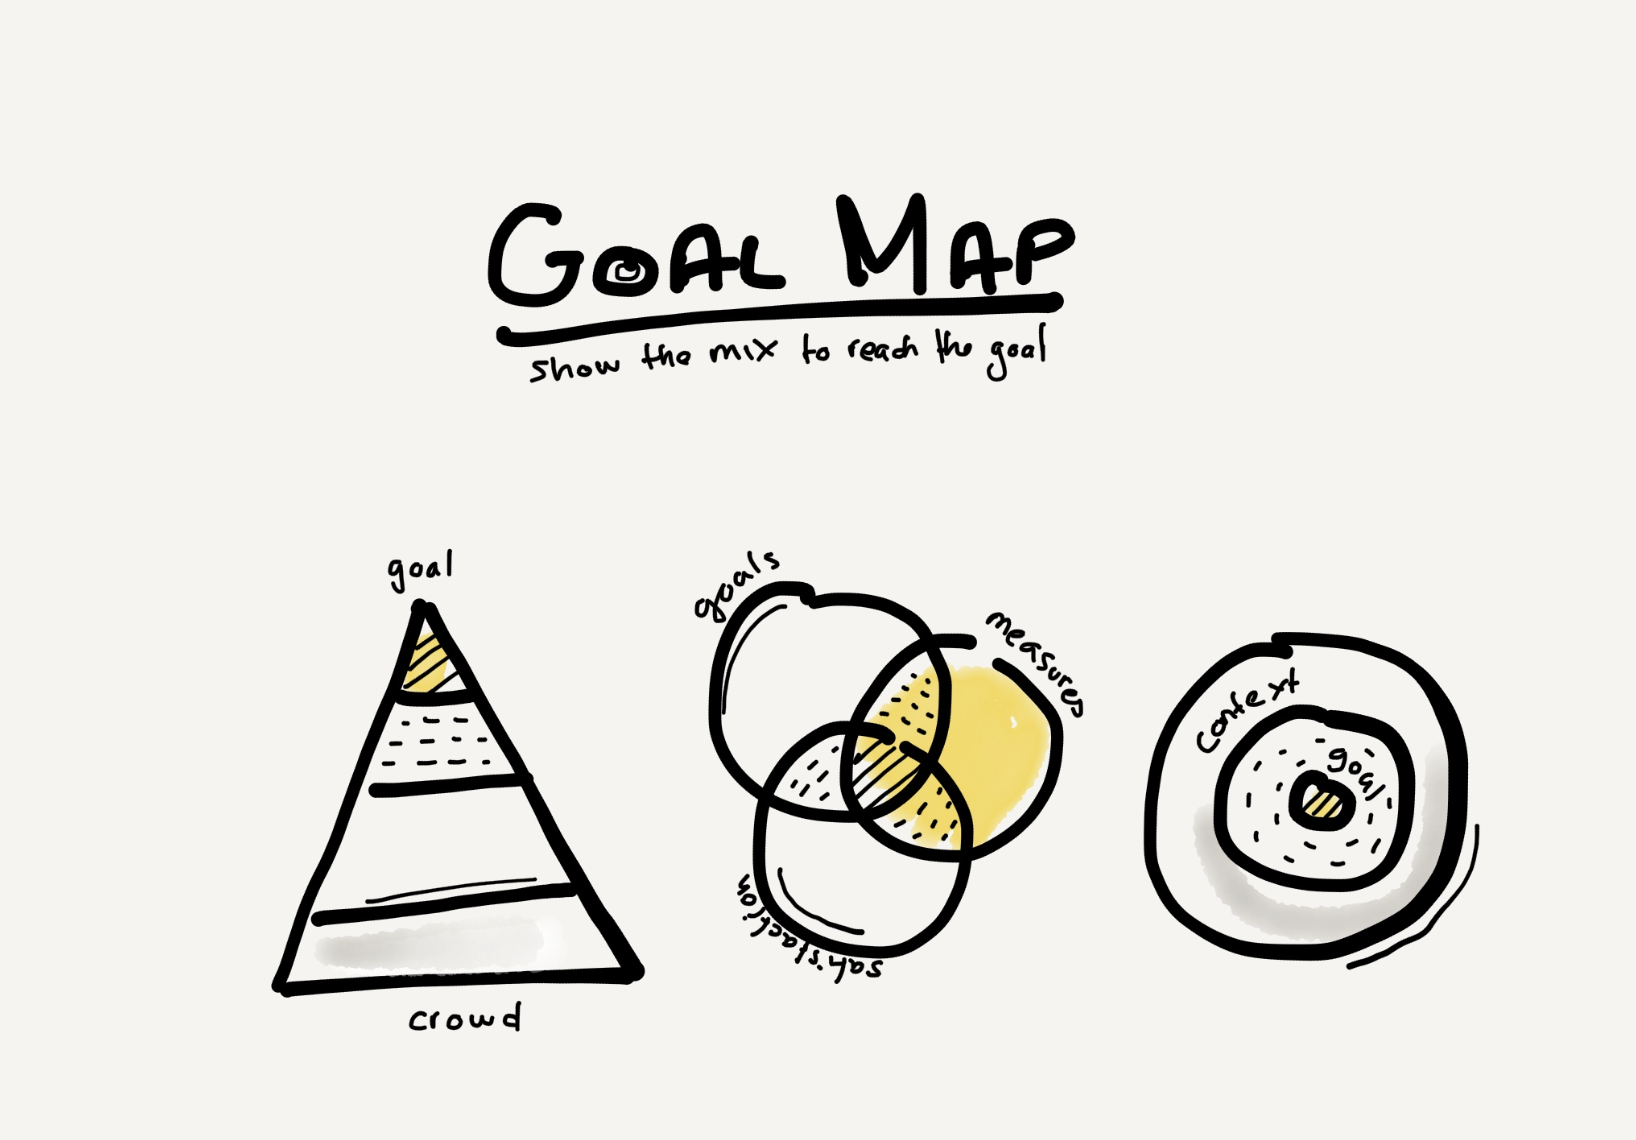
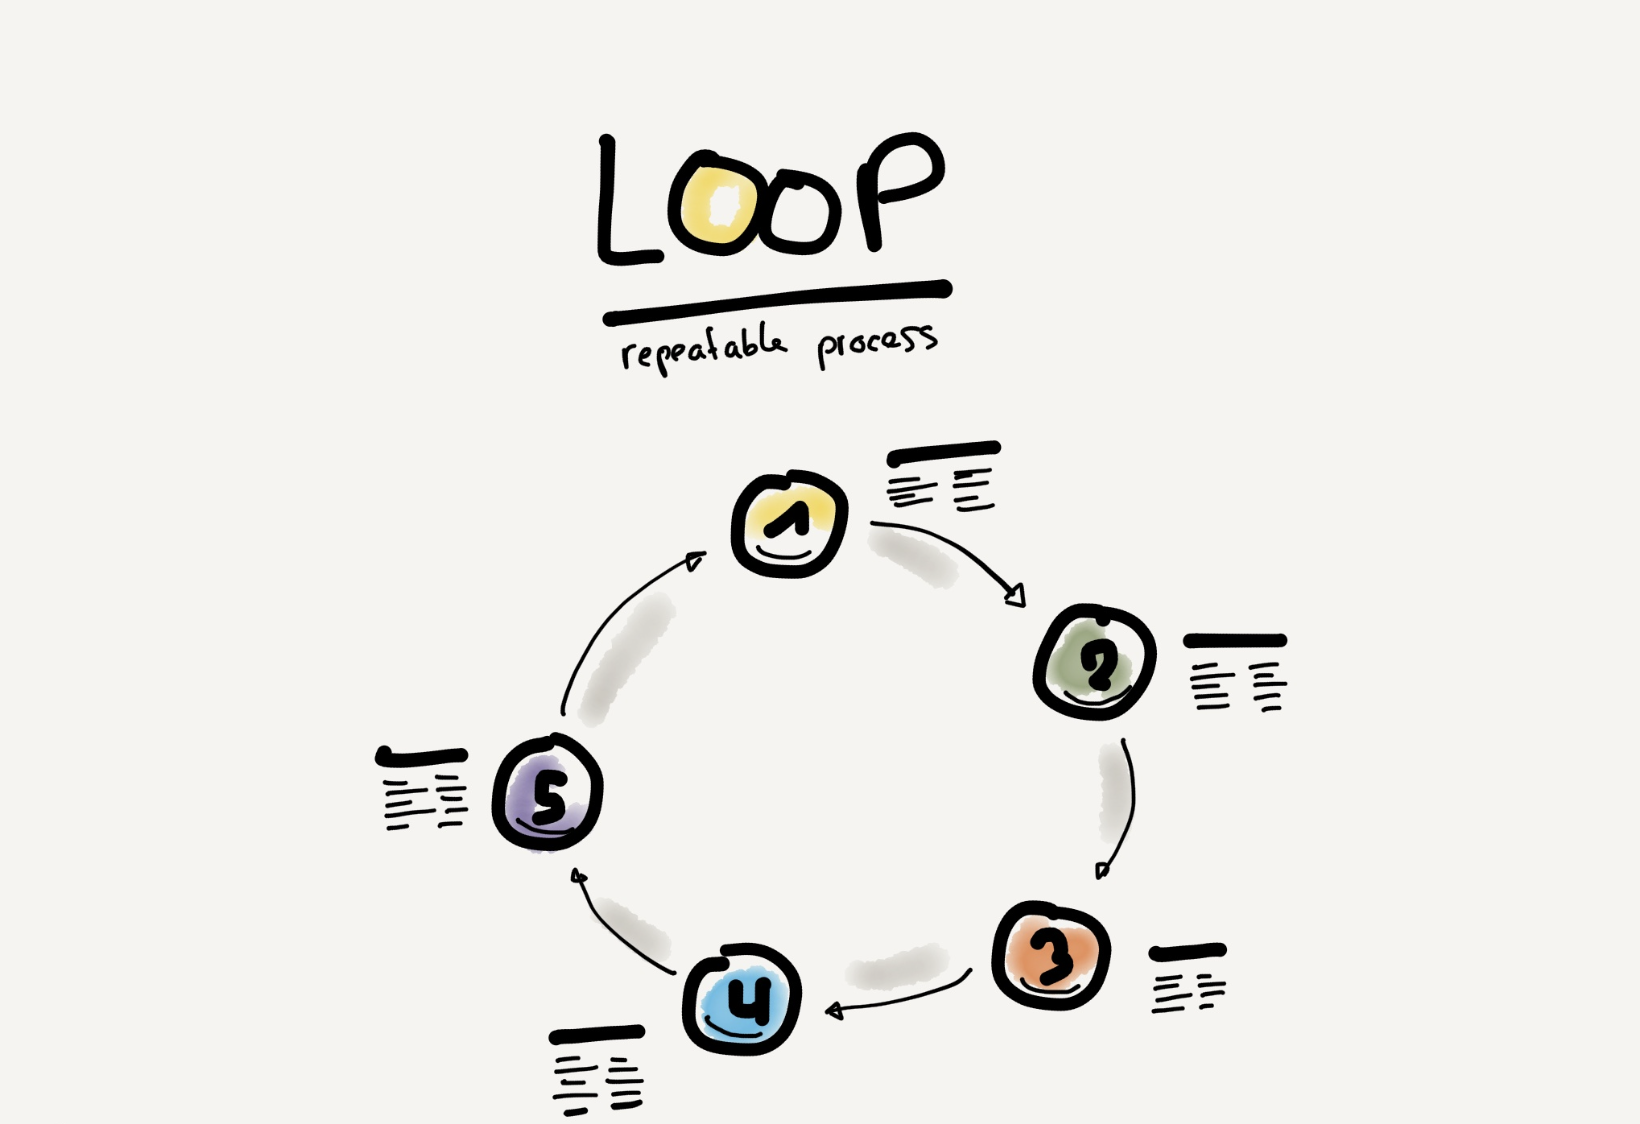
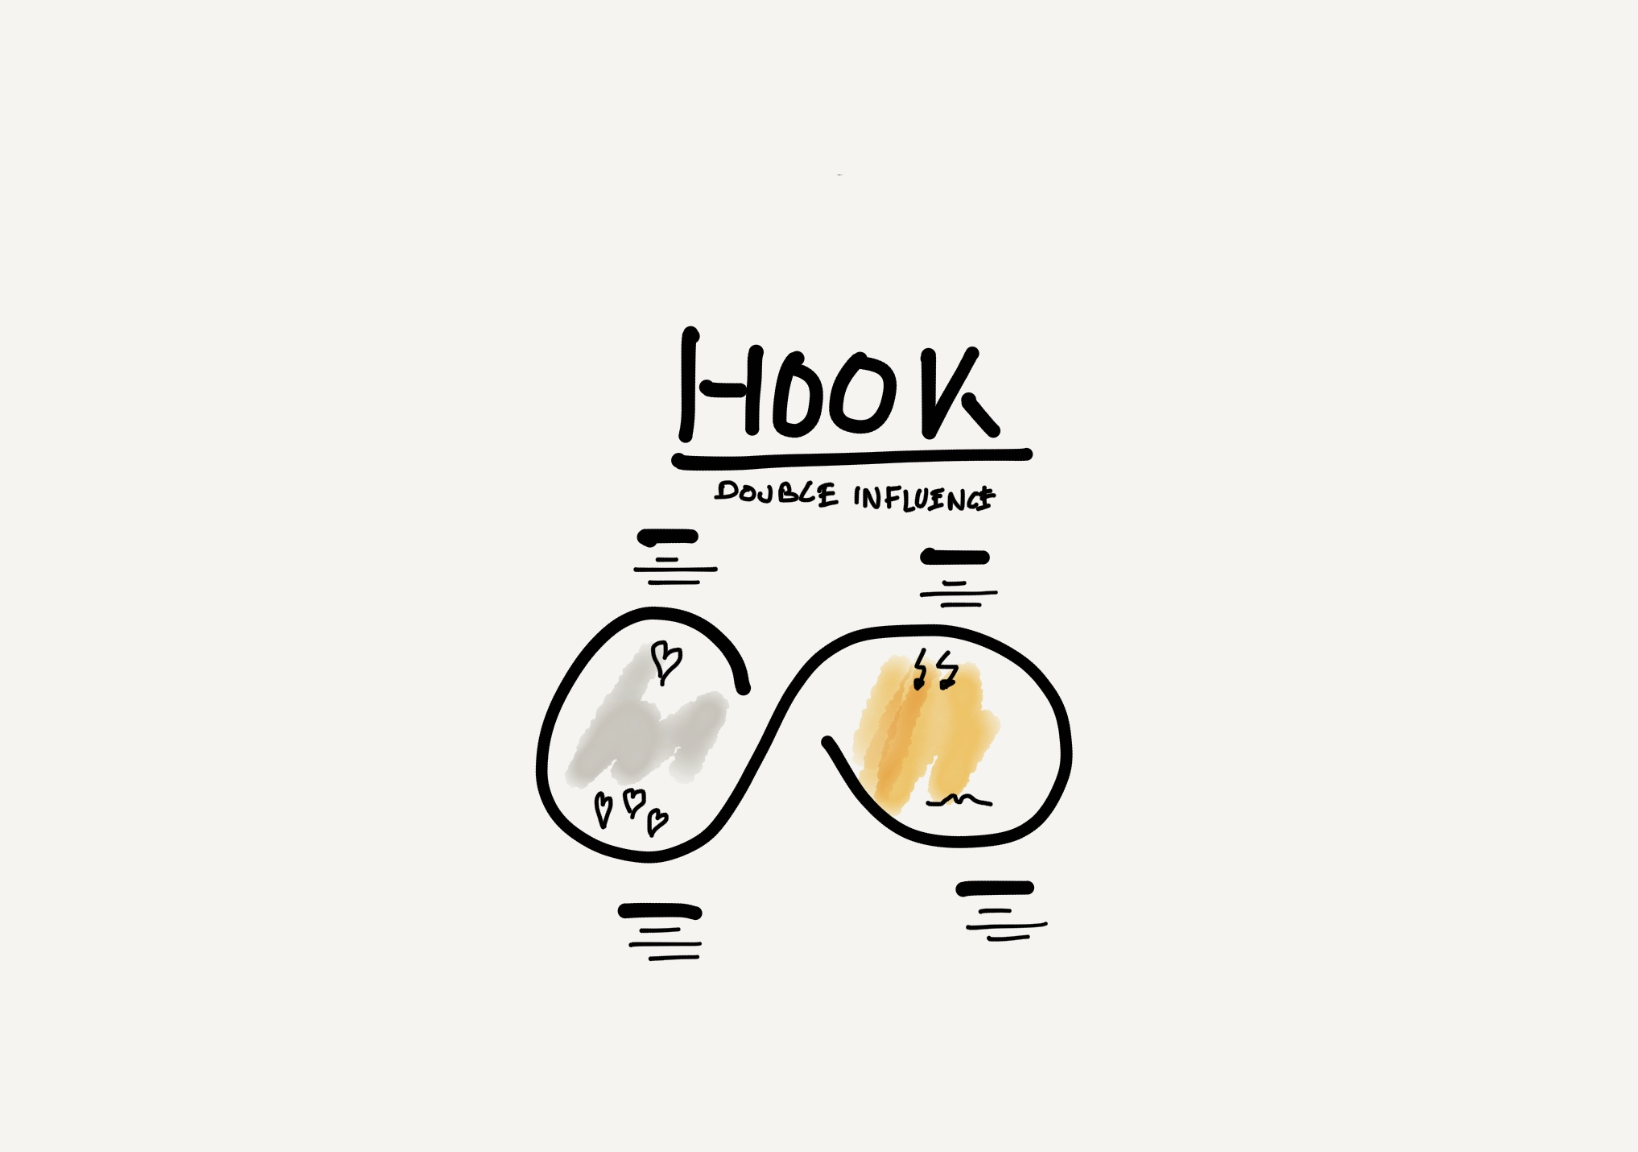
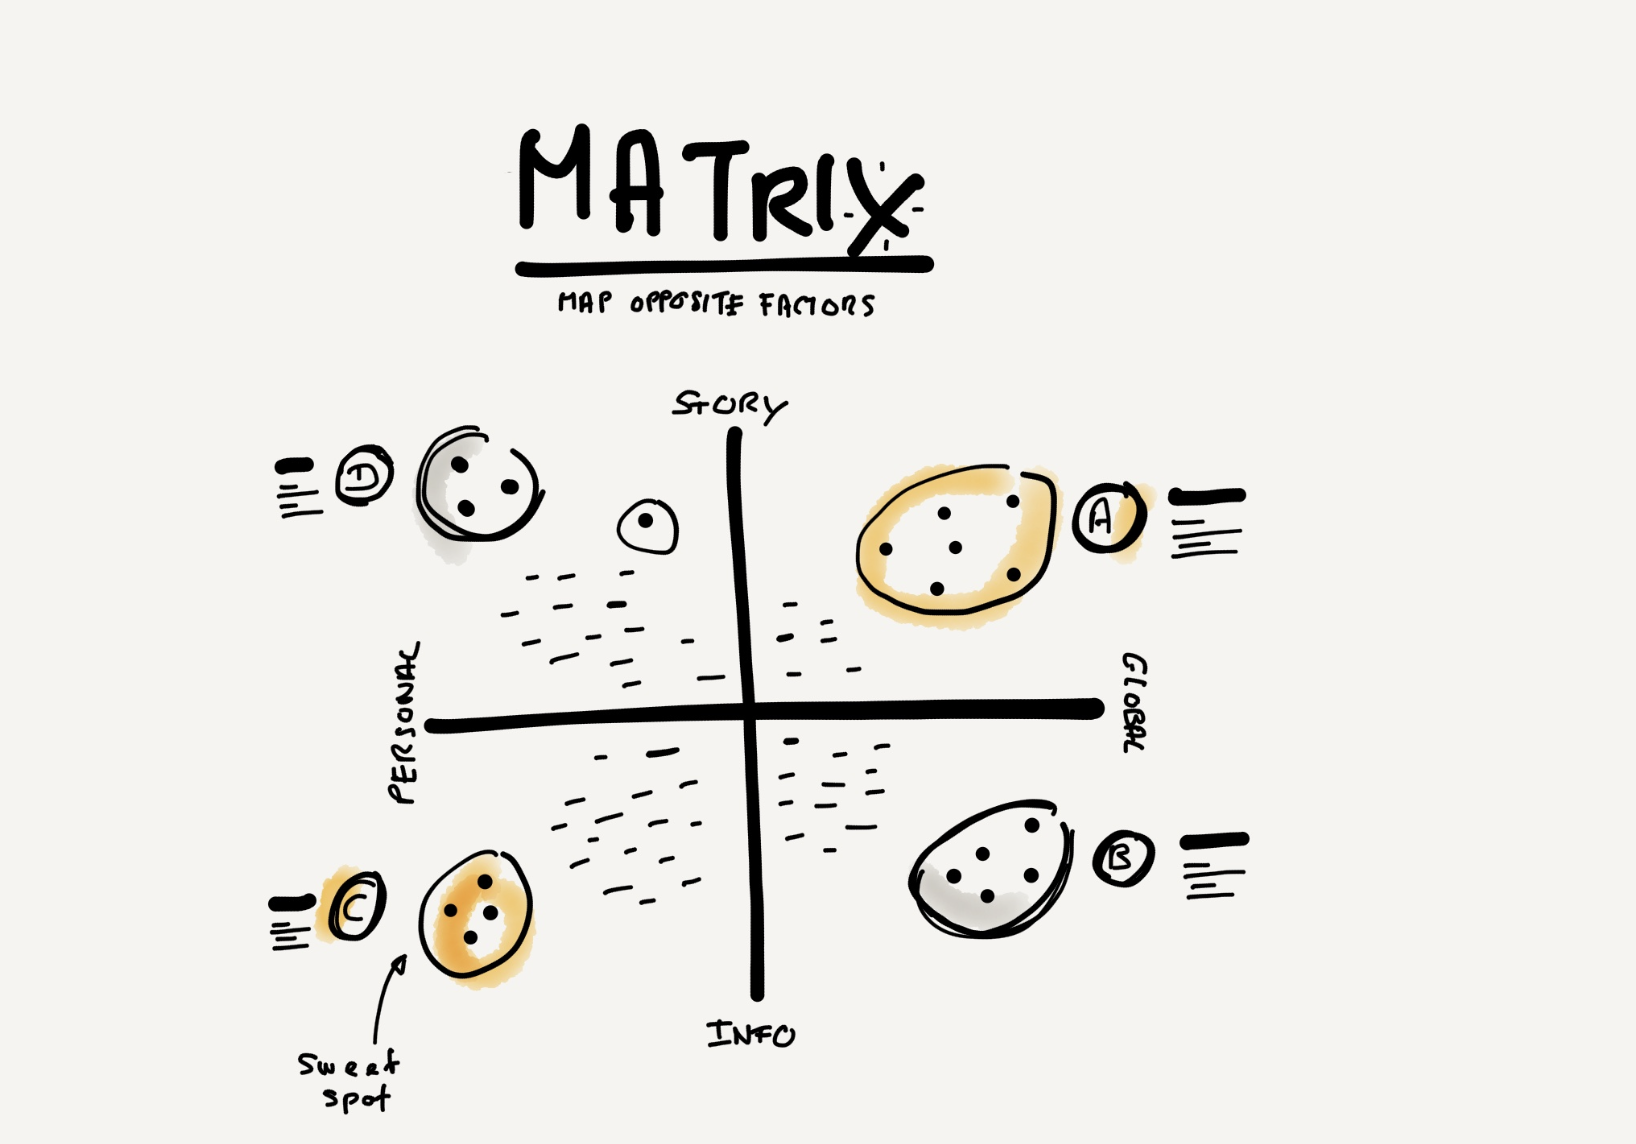
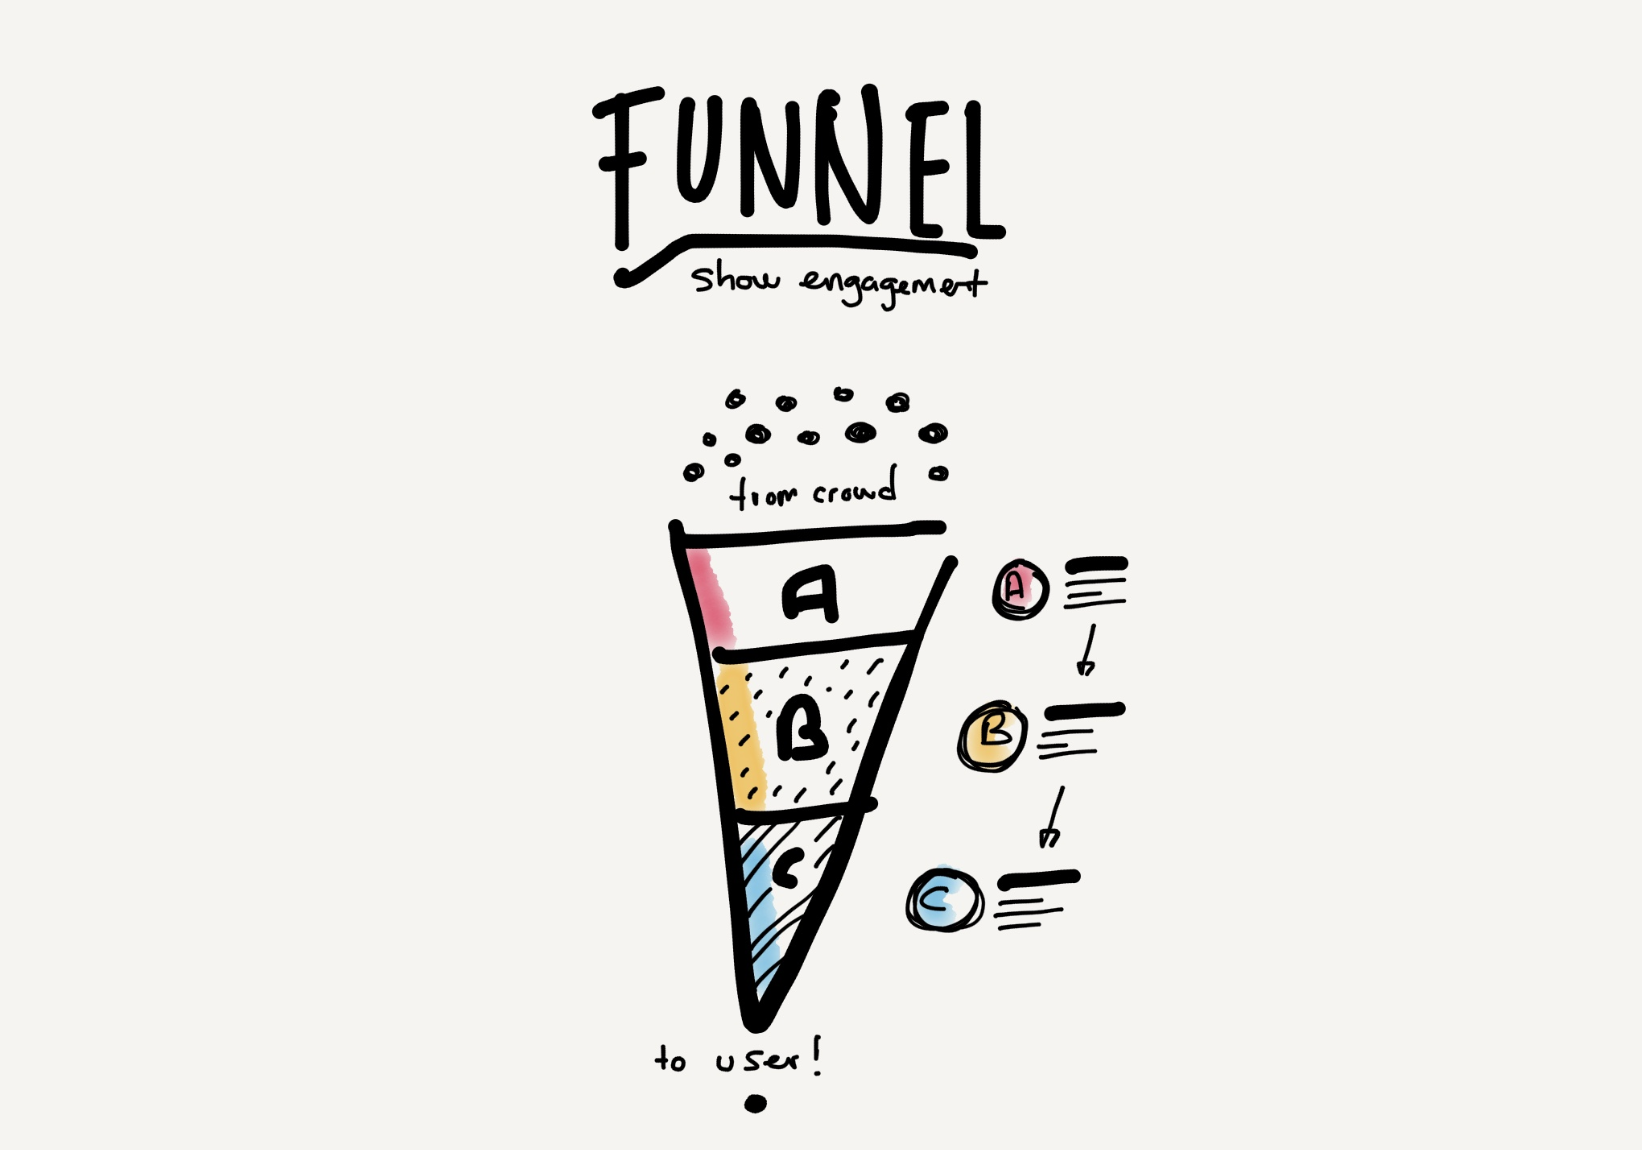
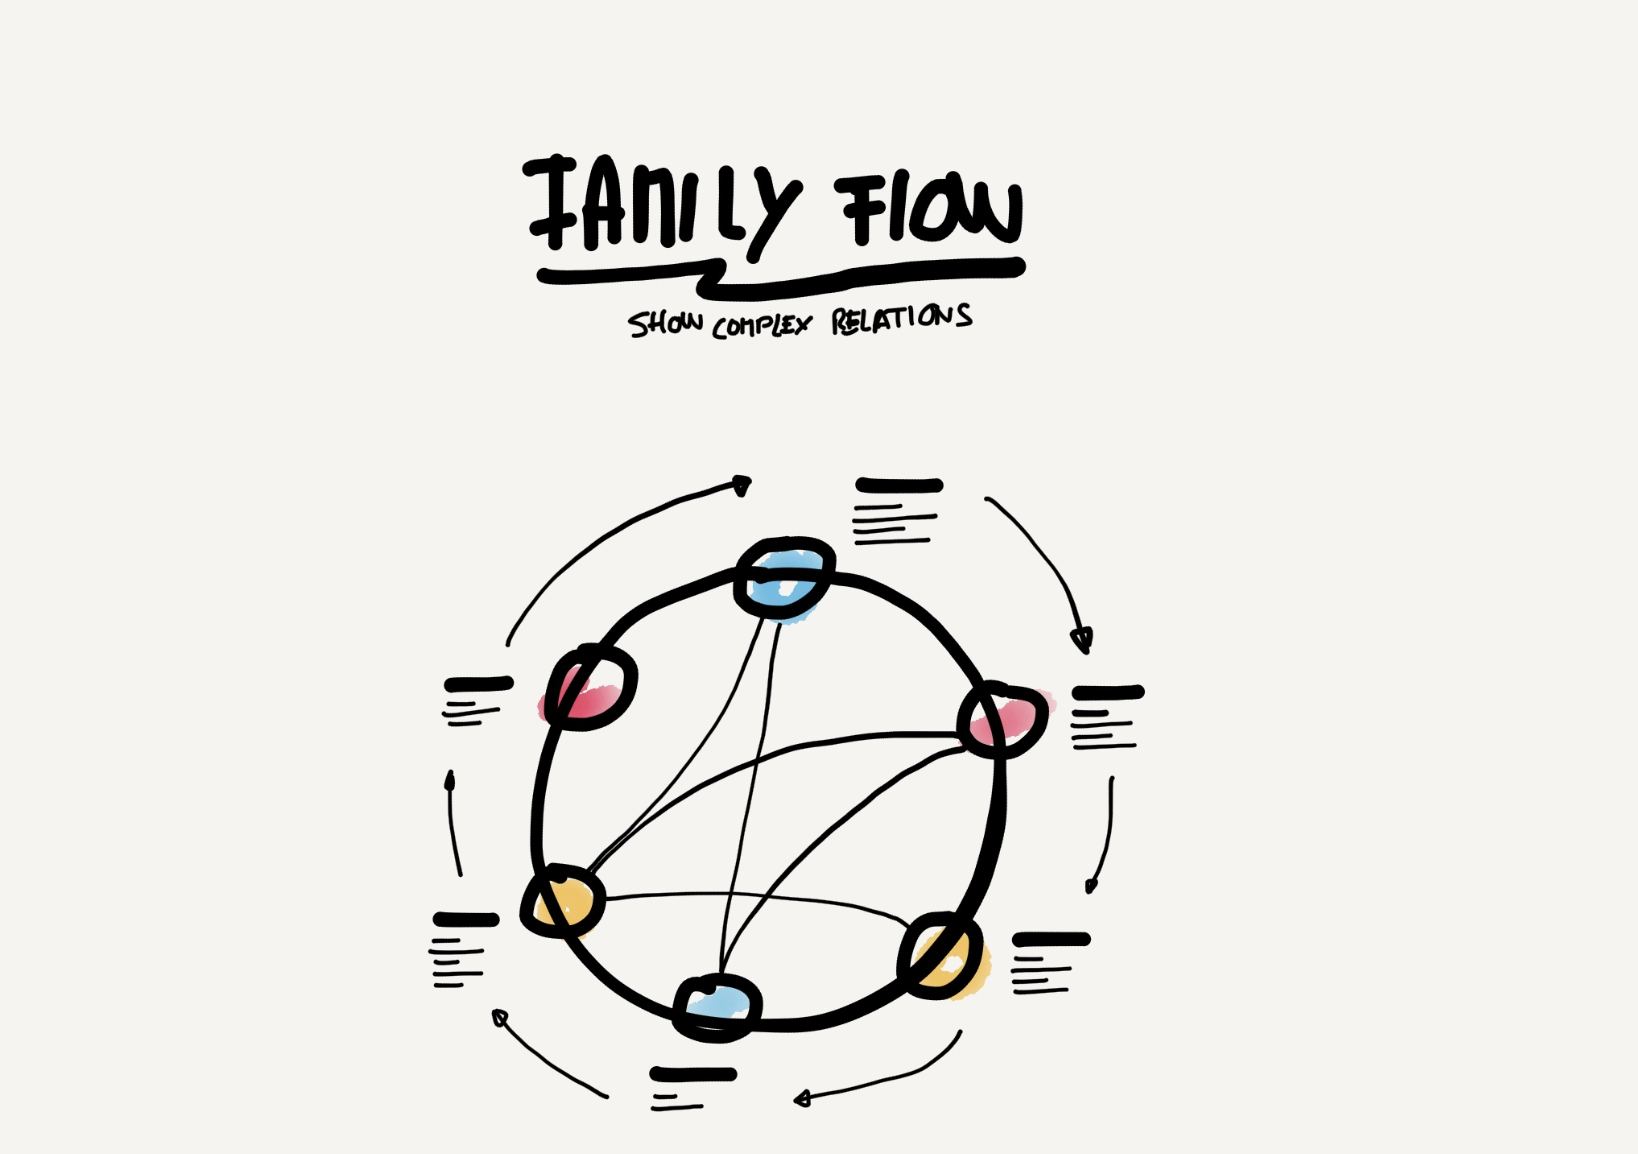
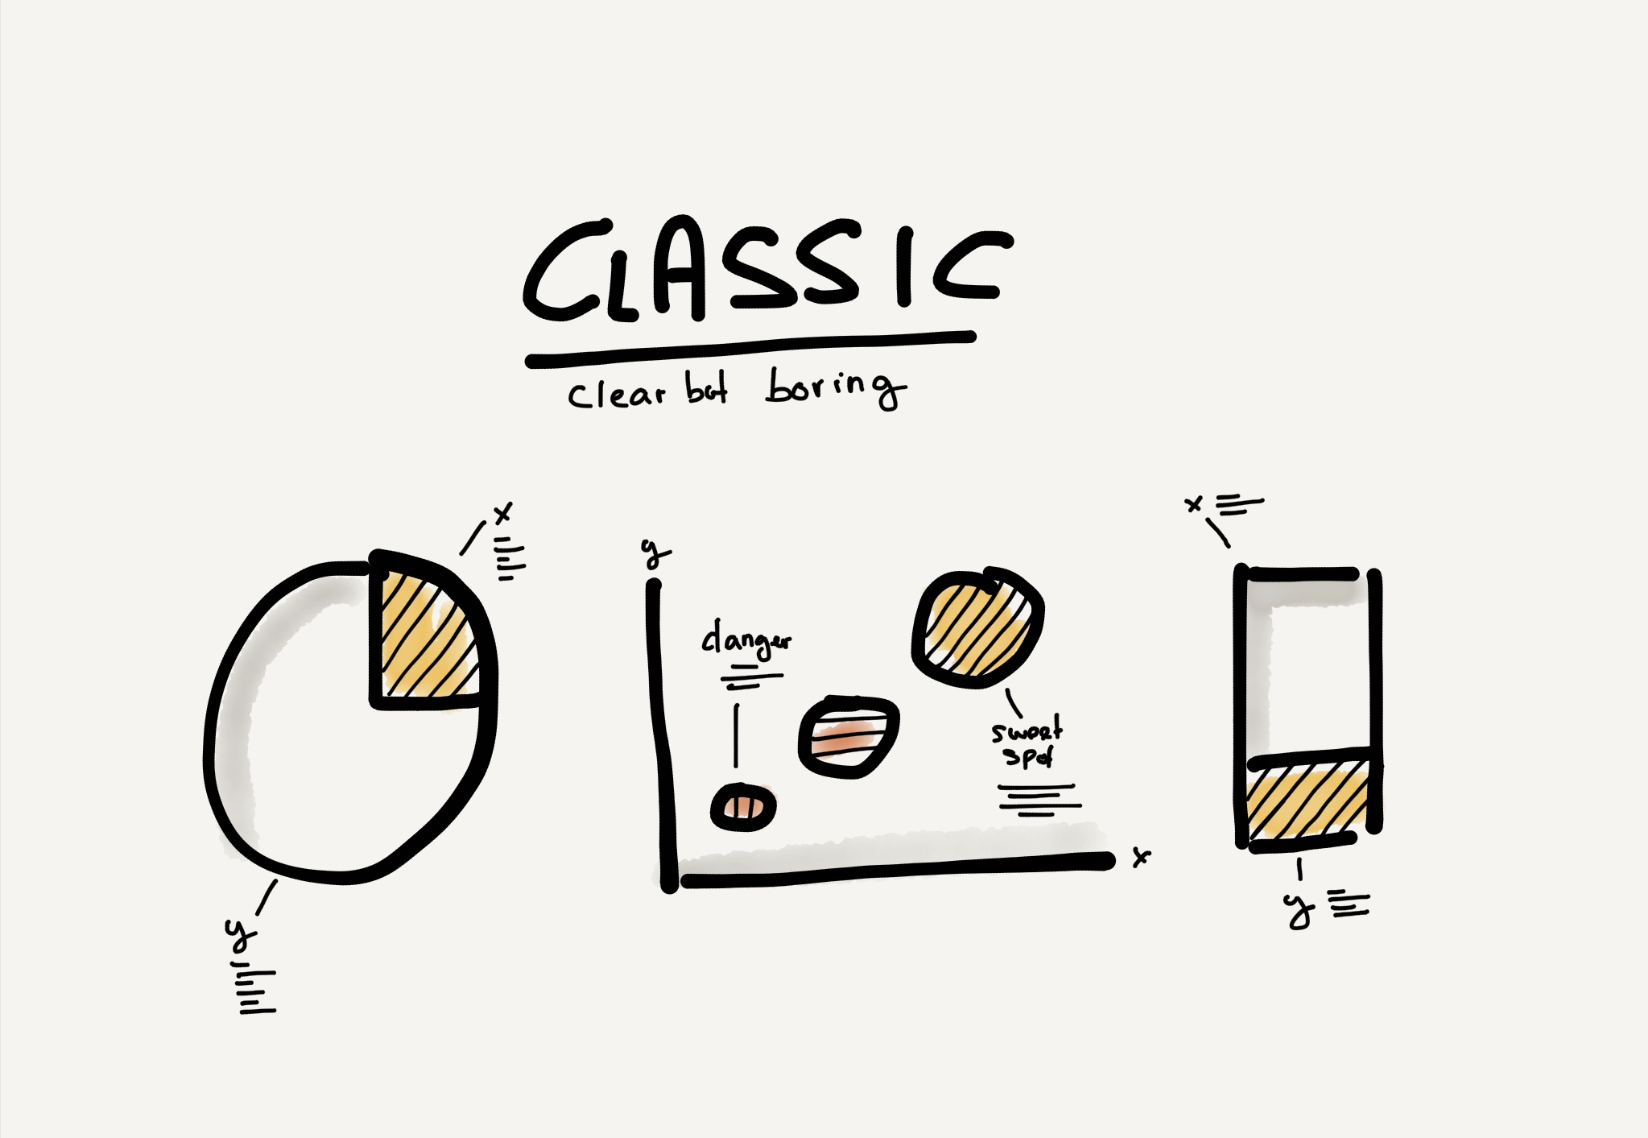
Back in the days when I was working in a marketing agency, I created a collection of 13 visualisations to help my project manager friends imagine how they could visualise complex processes, learnings or strategies with simple shapes:

What the experts say

Obviously there are way more possibilities to do so as you can discover on specialized publications and websites like:

  • Information is Beautiful

  • Storytelling with Data

  • Flowing Data

Q&A: Research in Service Design

Buy nowLearn more
  • How do I verify that there are enough people with this problem?
  • How to prioritize user research?
  • What are good structures for a prototype?
  • Does research in service design look like research in social sciences or market research?
  • How can I know if I have a good product/service market fit?

Mapping

  • How do you start a competition analysis for a new physical service?
  • What are tricks when creating digital maps with Google Maps for research?

Recruiting and compensation of research participants

  • How much should I pay research participants?
  • What are important elements to put in a screener?
  • Should feedback be free?
  • Should I use family and friends in my prototyping testing sessions?
  • How do you recruit users and testers?
  • What are the different ways to recruit research participants?

Research reports

  • How can you make your research age well?
  • How can I visualise complex ideas with simple forms?
  • What's a good structure for a research report?
  • What are examples of research reports?
  • What information should be included in a design report?
  • ▶️ What is a good structure for a slide that summarises a research report?
  • ▶️ What are different types of research insights?
  • Why do I make websites for some workshop reports?

Synthesizing research

  • ▶️ How to structure the synthesis or insights of user testings?
  • How to analyze interviews or research data?
  • What to do when I'm stuck in analysis paralysis?
  • How can I turn open questions into numbered data?
  • How do I choose the chart type to show my data?
  • ▶️ What do I do with all the research I've made?

Surveys for Service Design

  • How can I combine surveys and interviews?
  • Is a survey a good start for a research project when you don't know much about the group you want to serve?
  • How can I make street or door to door survey less akward?

Note taking during research

  • How do you take notes during user interviews?
  • Where can I find sample interviews to train my note-taking skills?
  • Should I collect more data?

Shadowing for Service Design

  • How can I speed up a shadowing session?
  • What can make or break a shadowing session?
  • What should I do after a shadowing session?