▶️ What is a good structure for a slide that summarises a research report?
▶️ What is a good structure for a slide that summarises a research report?
Q&A: Research in Service Design
Recruiting and compensation of research participants
Recruiting and compensation of research participants
Research reports
Research reports
Synthesizing research
Synthesizing research
In short and with an example
Use the 1-3 summary slide
1 sentence: The titles of each column when combined together should form one sentence
3 columns: Divided the slide in three columns with each it's own key idea
The video in details
I’ve made plenty of reports over the years about stakeholder interviews, field research or testing of prototypes.
Each of these reports is something that is custom made, but there is one slide structure that I tend to stick to.
How it works
Meet the 1-3 summary slide: it’s one sentence that can you can divided into three ideas.
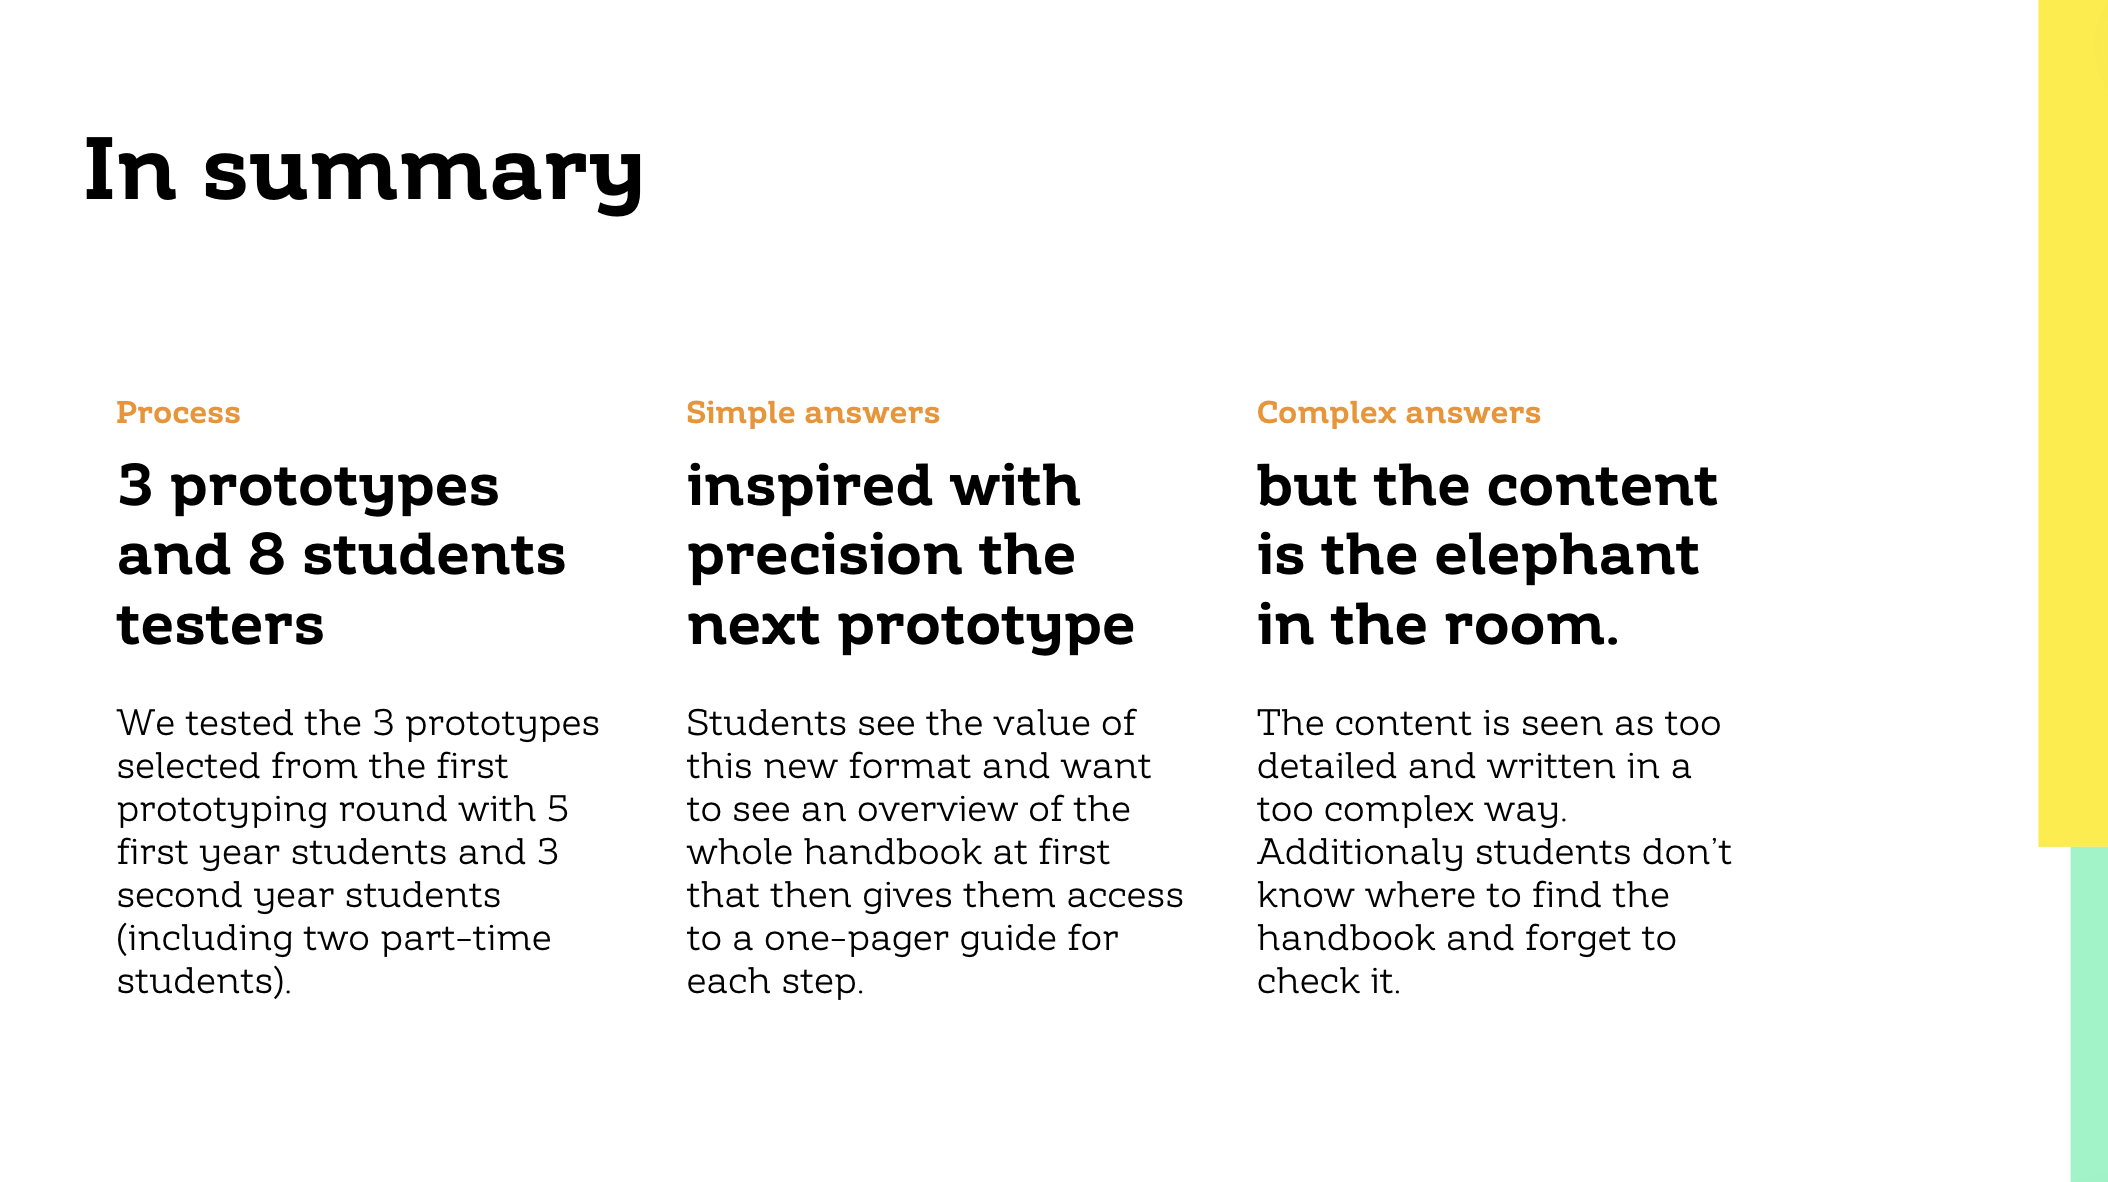
Let’s see how it looks in a real project. This summary slide comes from a report of a tiny prototype testing session we did for the Master Design of the HSLU. In this research we wanted to improve the handbook that helps students create a great Master Thesis.
One sentence
What makes this summary slide a bit fancy, is that I force myself to create one big sentence with the the titles the three columns.
As you see in this report, it creates the following sentence.
3 prototypes and 8 student testers inspired with precision the next prototype but the content is the elephant in the room.
A tiny detail that I like here is the « elephant in the room » expression. This makes people think: « Oh I want to know about that! »
When possible, I try to say enough in that sentence that it is clear, but omit enough so that people want to read more.
Three ideas
And then for each column I add a few extra information to make sure people don’t ask themselve: « So what? ».
In this particular example I’ve divided the three ideas by:
Process: What did we do. This helps the person who wasn’t part of the whole project, to quickly understand what this is all about. In fact here, I could have been more precise by mentionning what the prototypes were about and from which school and program the students are (even if this information is part of the cover of the report)
Simple answers: what’s something we learned that doesn’t create debate. This helps the « getting shit done » people who are action oriented to be happy.
Complex answers: what’s something we learned that’s super interesting but can open a debate. This helps the « system thinkers » to see that this report is also smart.
With just three columns, this slide structure forces me to decide what are the three most important information I want people to know about this report.
I find that when it comes to synthesis, having a sort of template to fill is easier than having to think both about what you’ve learned and how you can best structure that learning. Here I can just focus on deciding what’s the most important.
Use the sandwich trick
To make this slide work like a strong summary I place it both at the start and at the end of most of my reports. So I’m sure that when people start reading they are reading the report with the right framing. And I’m also sure that once they finish it, they remember the key facts I want them to remember. Because yes, we keep on remembering better what’s at the end of a presentation than what’s in the middle.
Conclusion
So whenever you have to create a summary for a long report, try out the 1-3 summary slide, with one sentence and three ideas.