How can I turn open questions into numbered data?
How can I turn open questions into numbered data?
Q&A: Research in Service Design
Recruiting and compensation of research participants
Recruiting and compensation of research participants
Research reports
Research reports
Synthesizing research
Synthesizing research

I'm not a quantitative data expert. However, I've noticed that for certain types of decision-makers, a good number is much stronger than a good story or insight based on qualitative research. But I still love the qualitative approach.
So, how can I turn qualitative data into numbers?
I analyse qualitative responses to an open question and sort them into patterns or categories, then turn them into graphs.
The step-by-step approach I follow
I'll show here how I used this approach in a project to better understand the needs of the local population in a specific area for an NGO.
Ask an open question in a survey
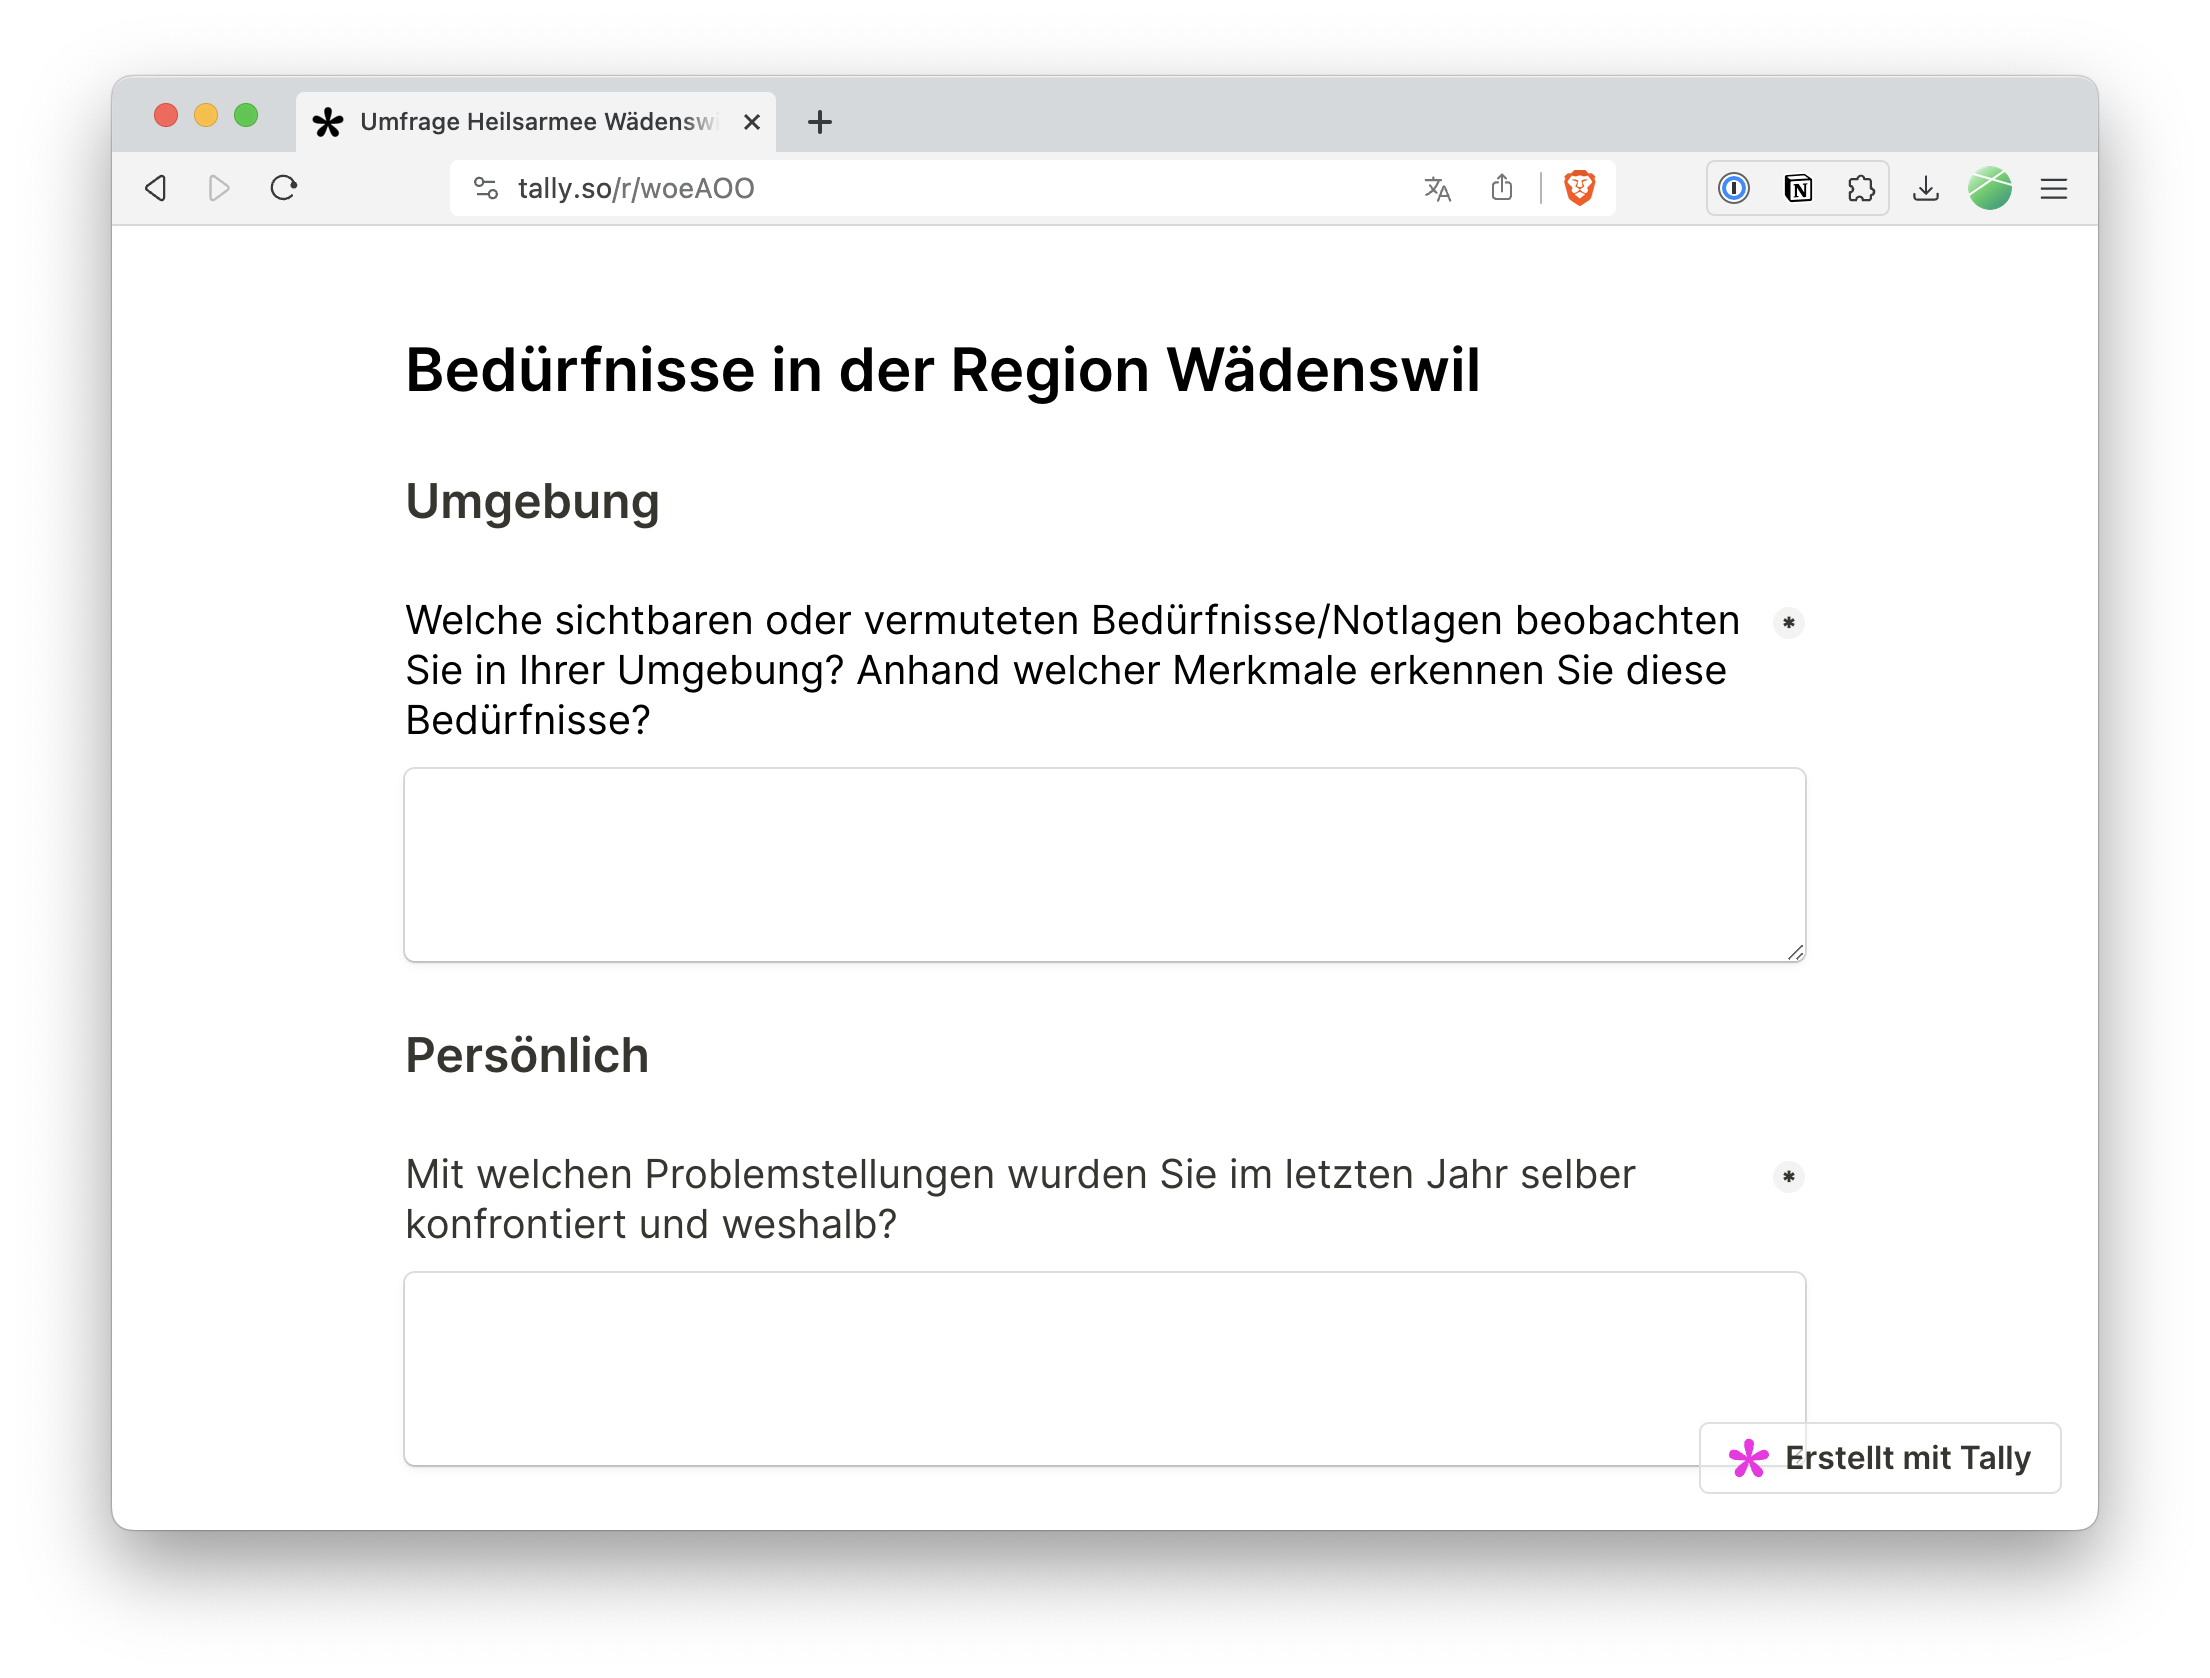
For example, one of the questions I've used in the past using a tool like Tally to build a survey: "What visible or suspected needs/emergencies do you observe in your environment? What characteristics do you use to identify these needs?"
To recruit the people for that specific survey I've worked with the recruiting agency TestingTime.
Why I like this approach
Such a open questions gives me both the problem and details about the why and how of the problem, which is pretty neat.
Code the answers with affinity sorting
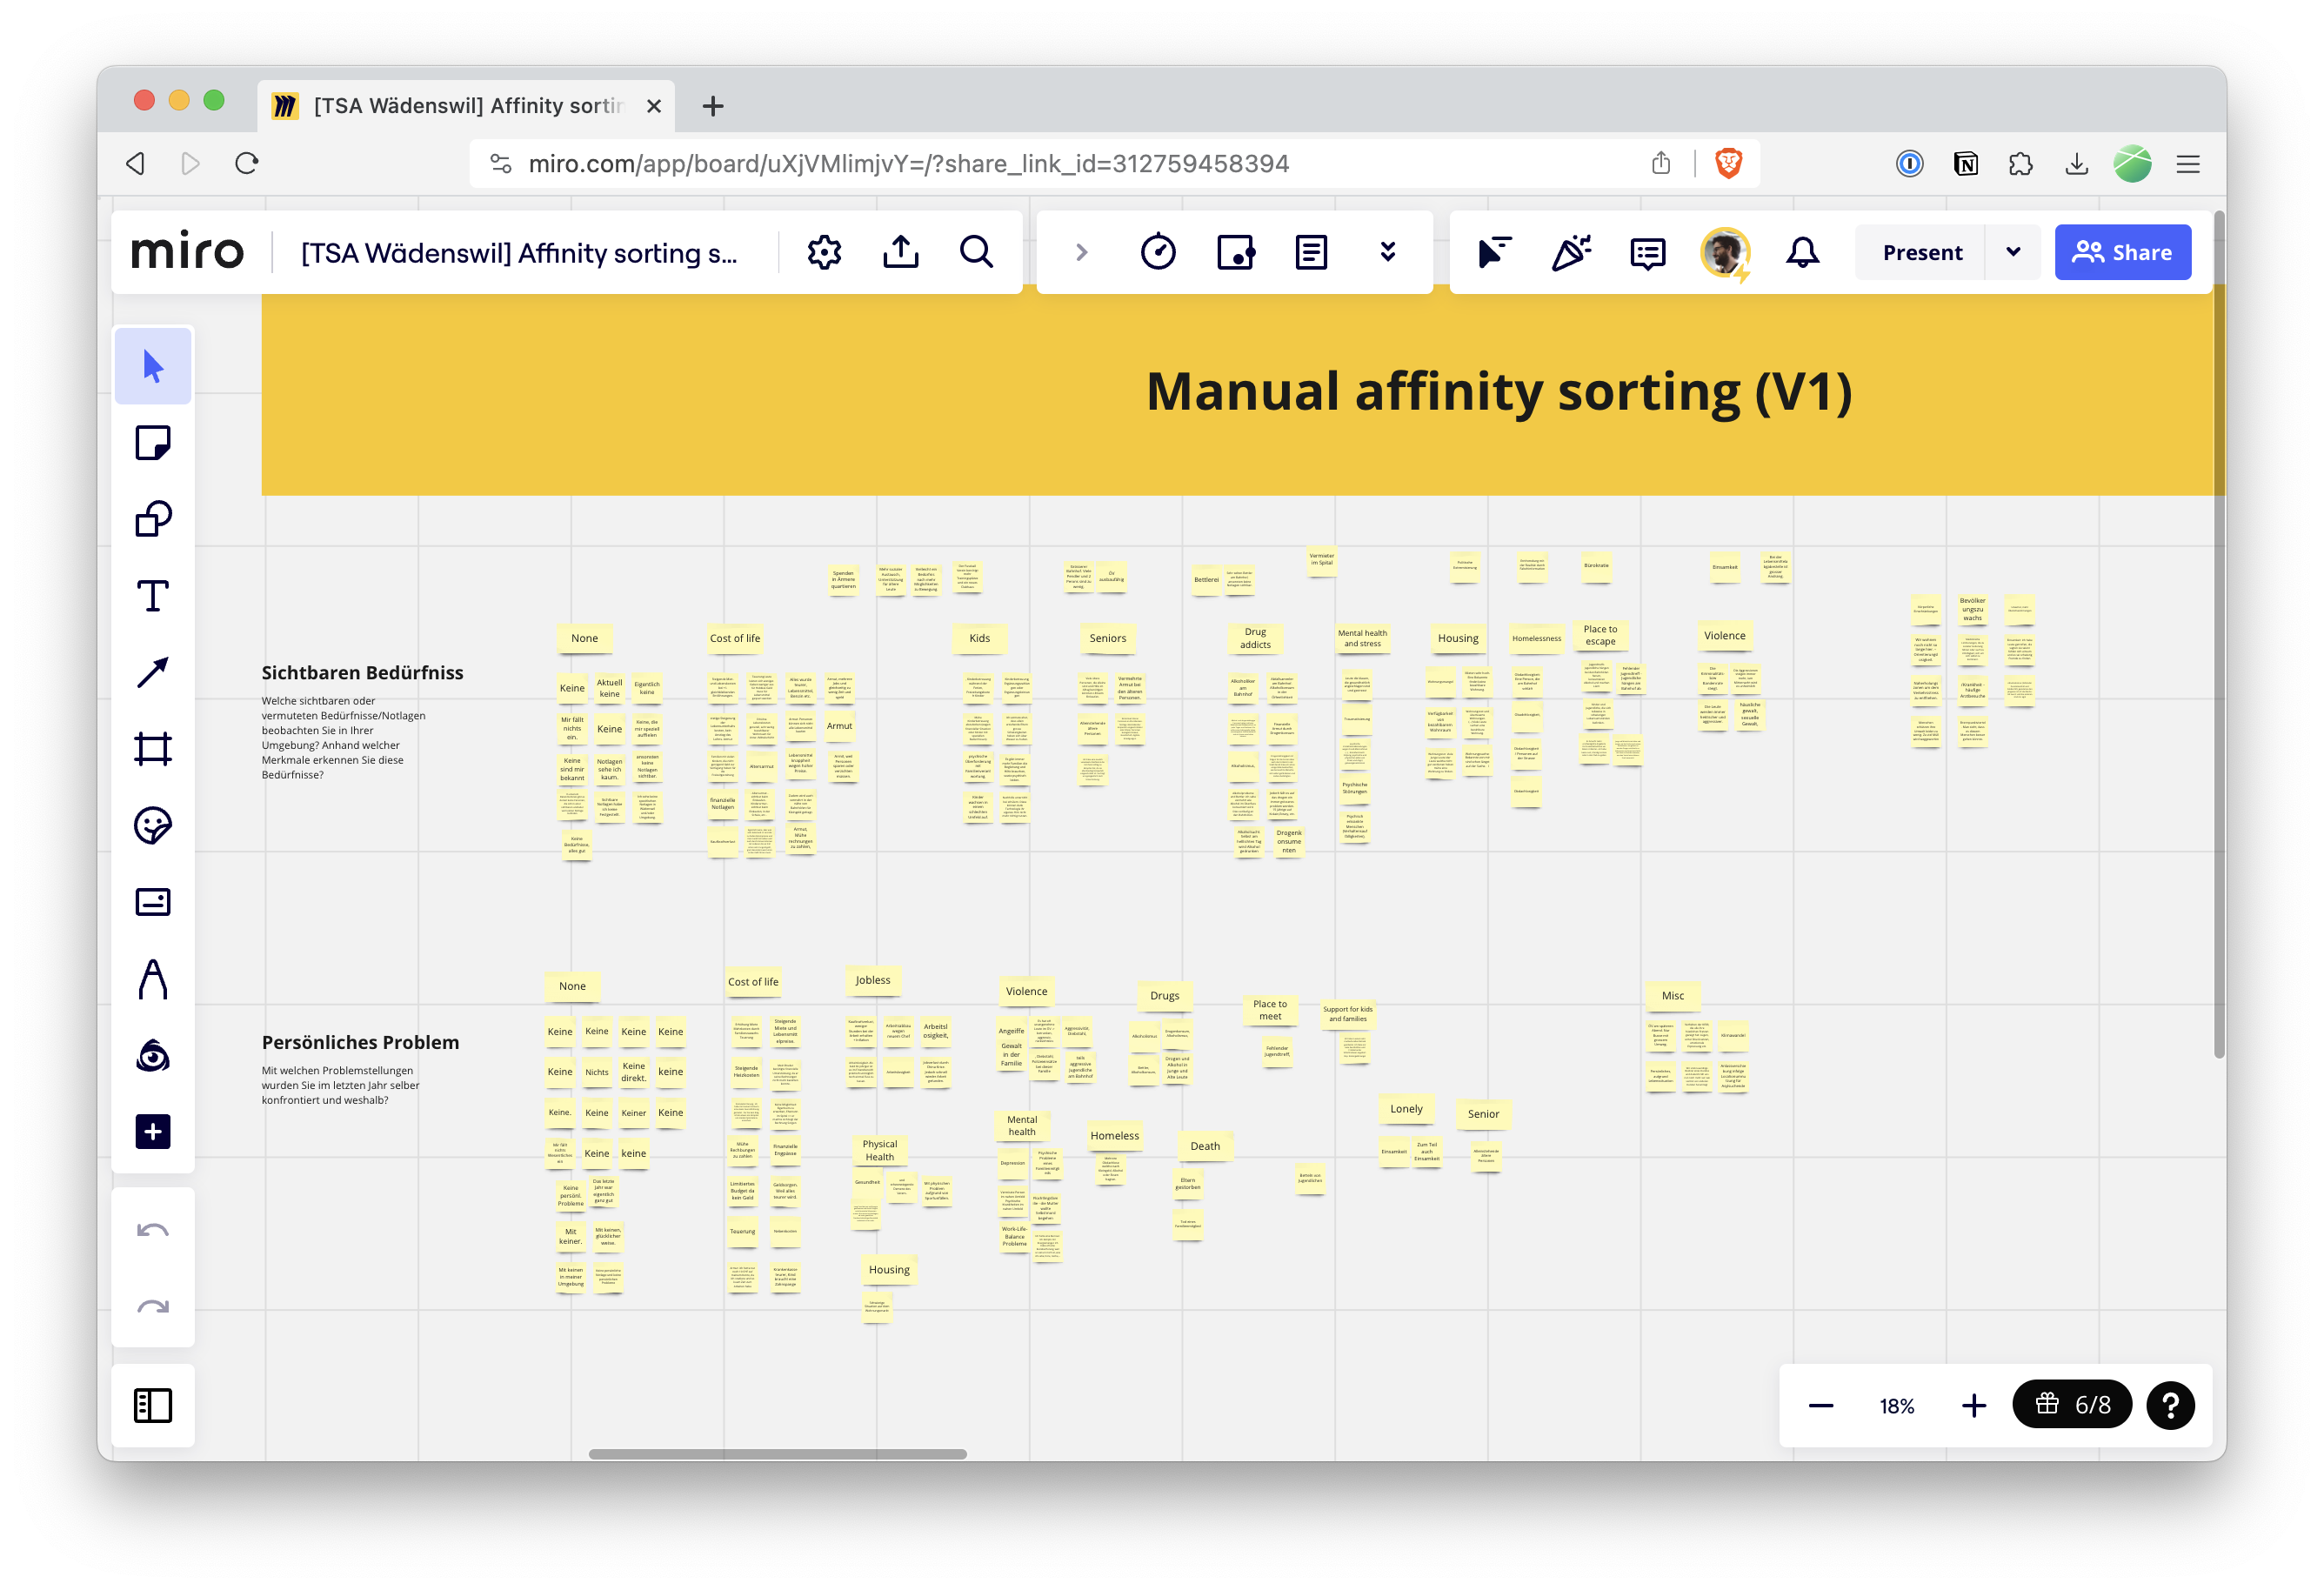

Once there are enough people who answered the survey, I then take each answer and split it in sticky notes in a whiteboard app like Miro.
When someone mentions several different ideas in one answer, I then split that answer into several sticky notes.
Once this is done, I slowly start to class the sticky notes, one after the other, using affinity sorting.
Why I like this approach
Instead of coming up with the possible answers and letting people select them in a drop-down in the survey, people give their answers, and I then discover the categories. This often leads to categories that I would never have thought about.
Count the number of mentions for each "category"
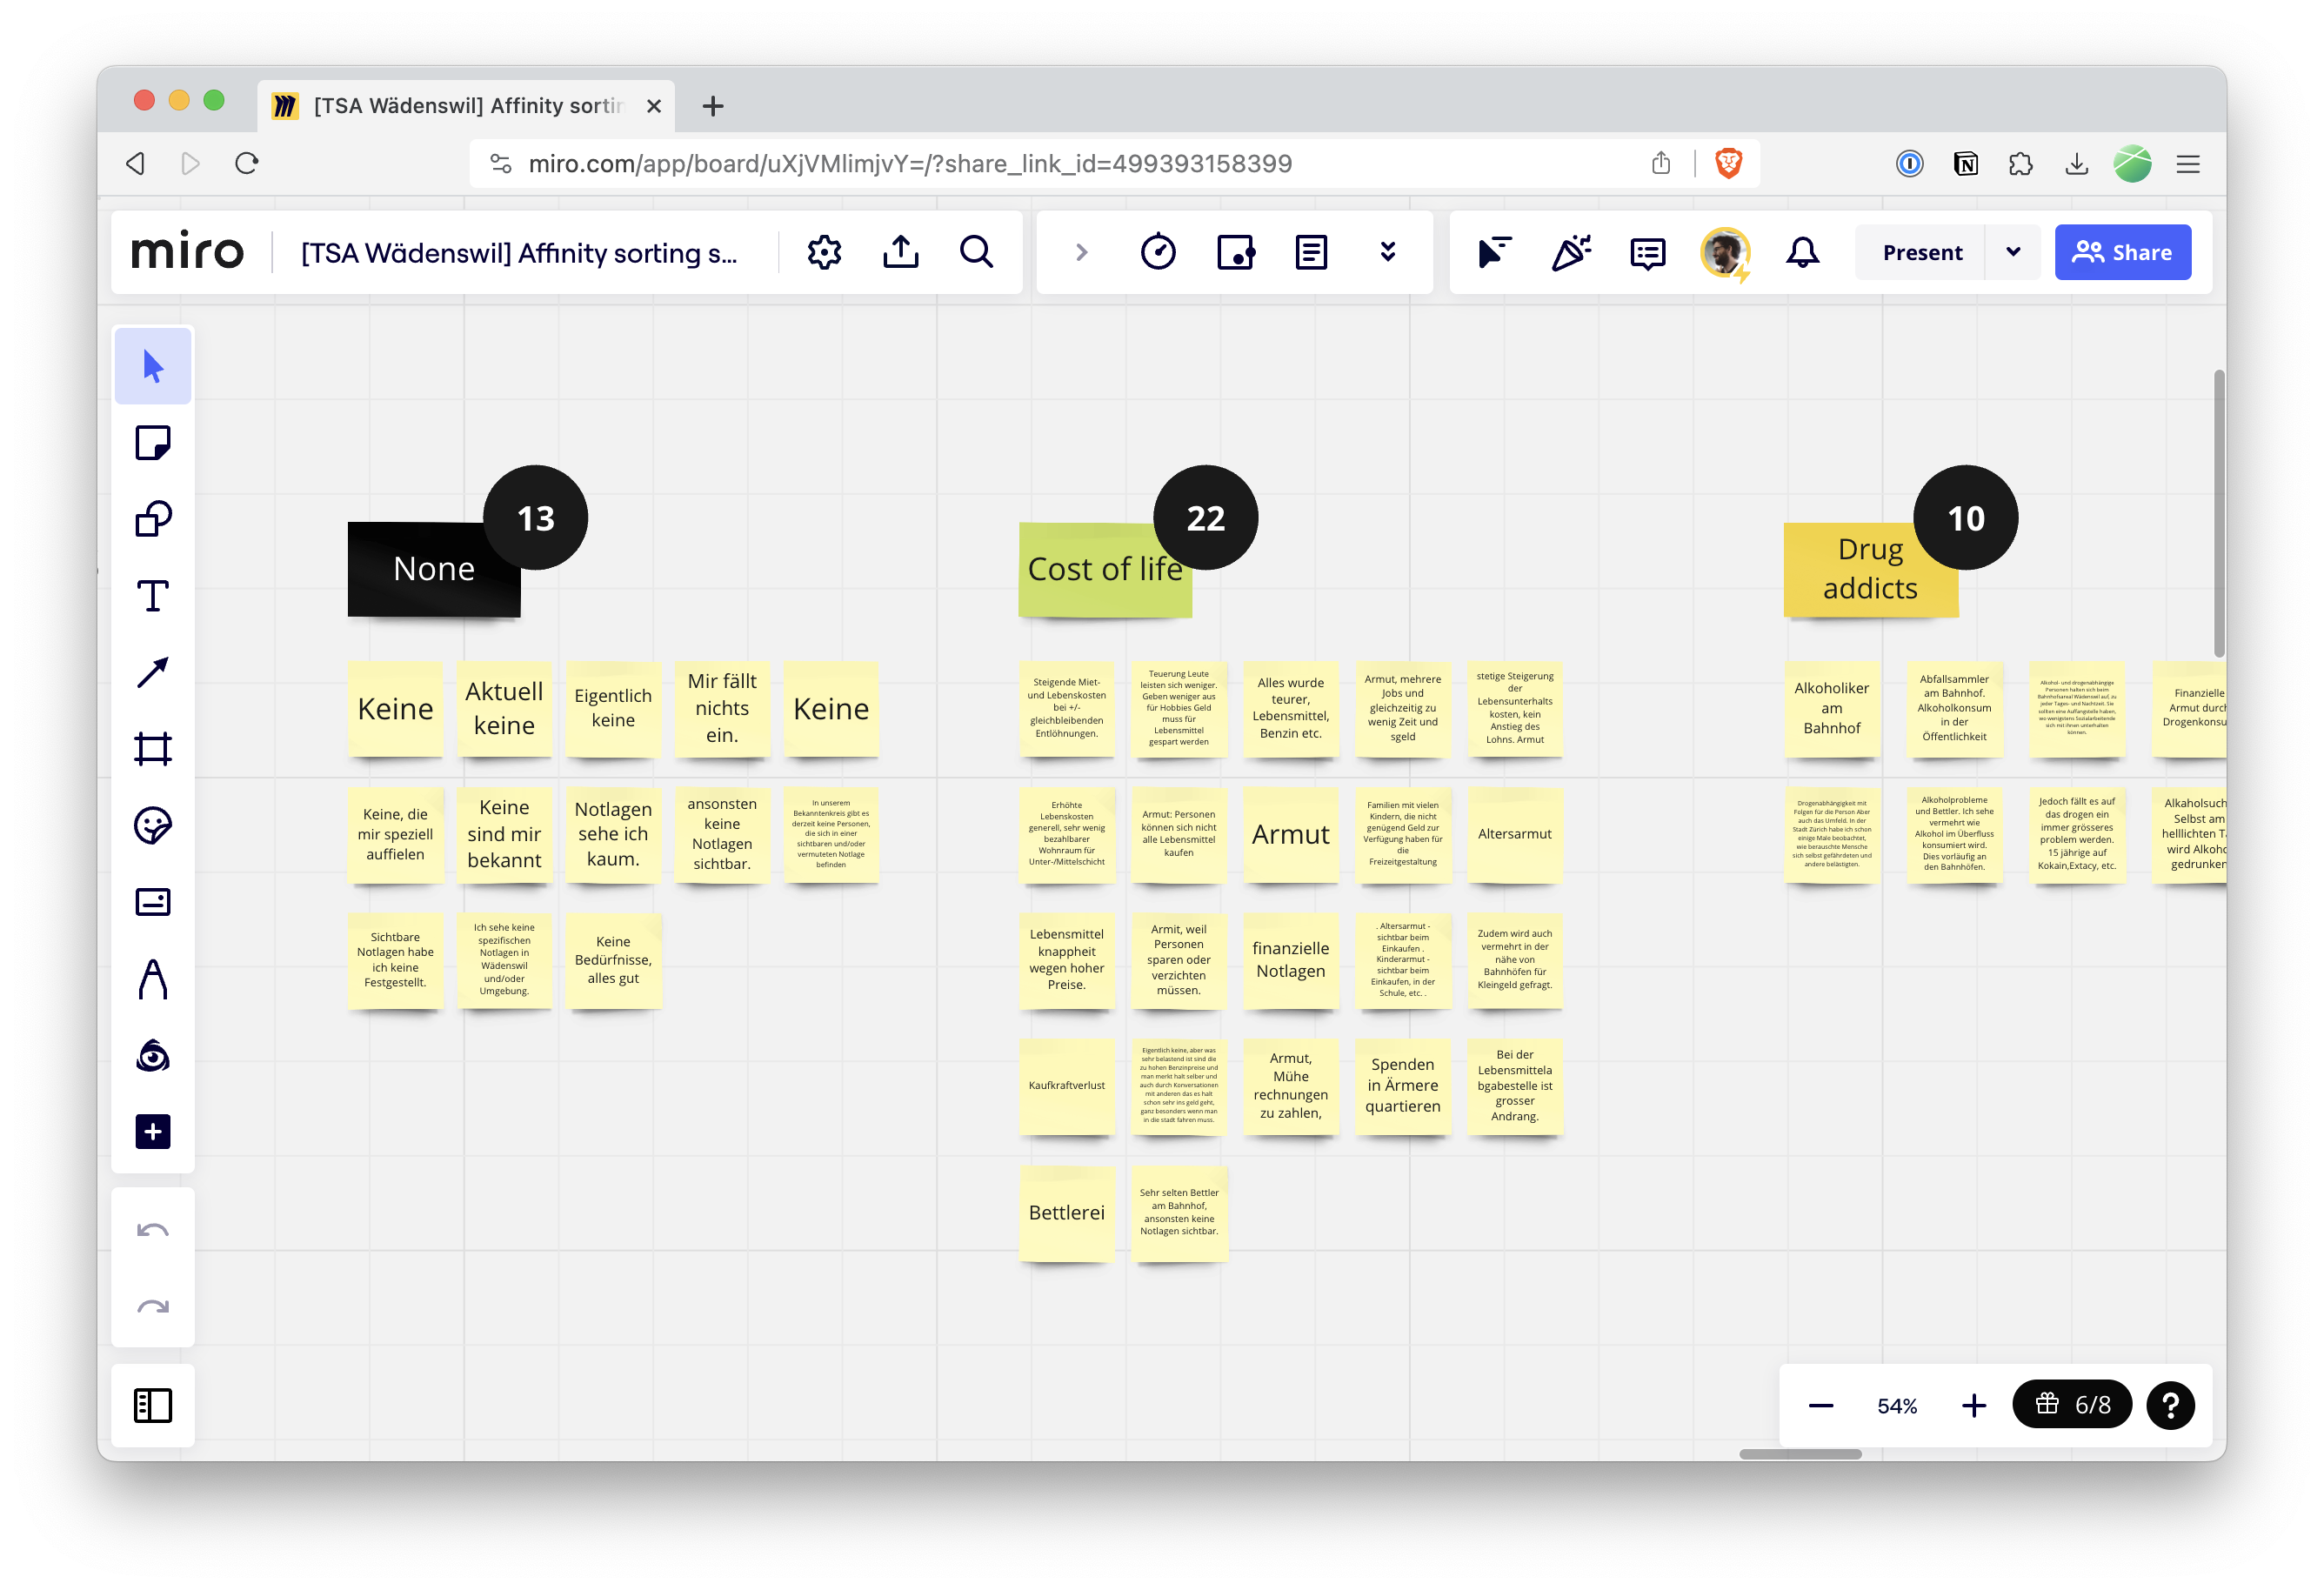
For each category, I now can easily count the number of mentions. So I can say things like: "The most mentioned urgency is the cost of life, especially due to inflation".
Transform these numbers in a graph
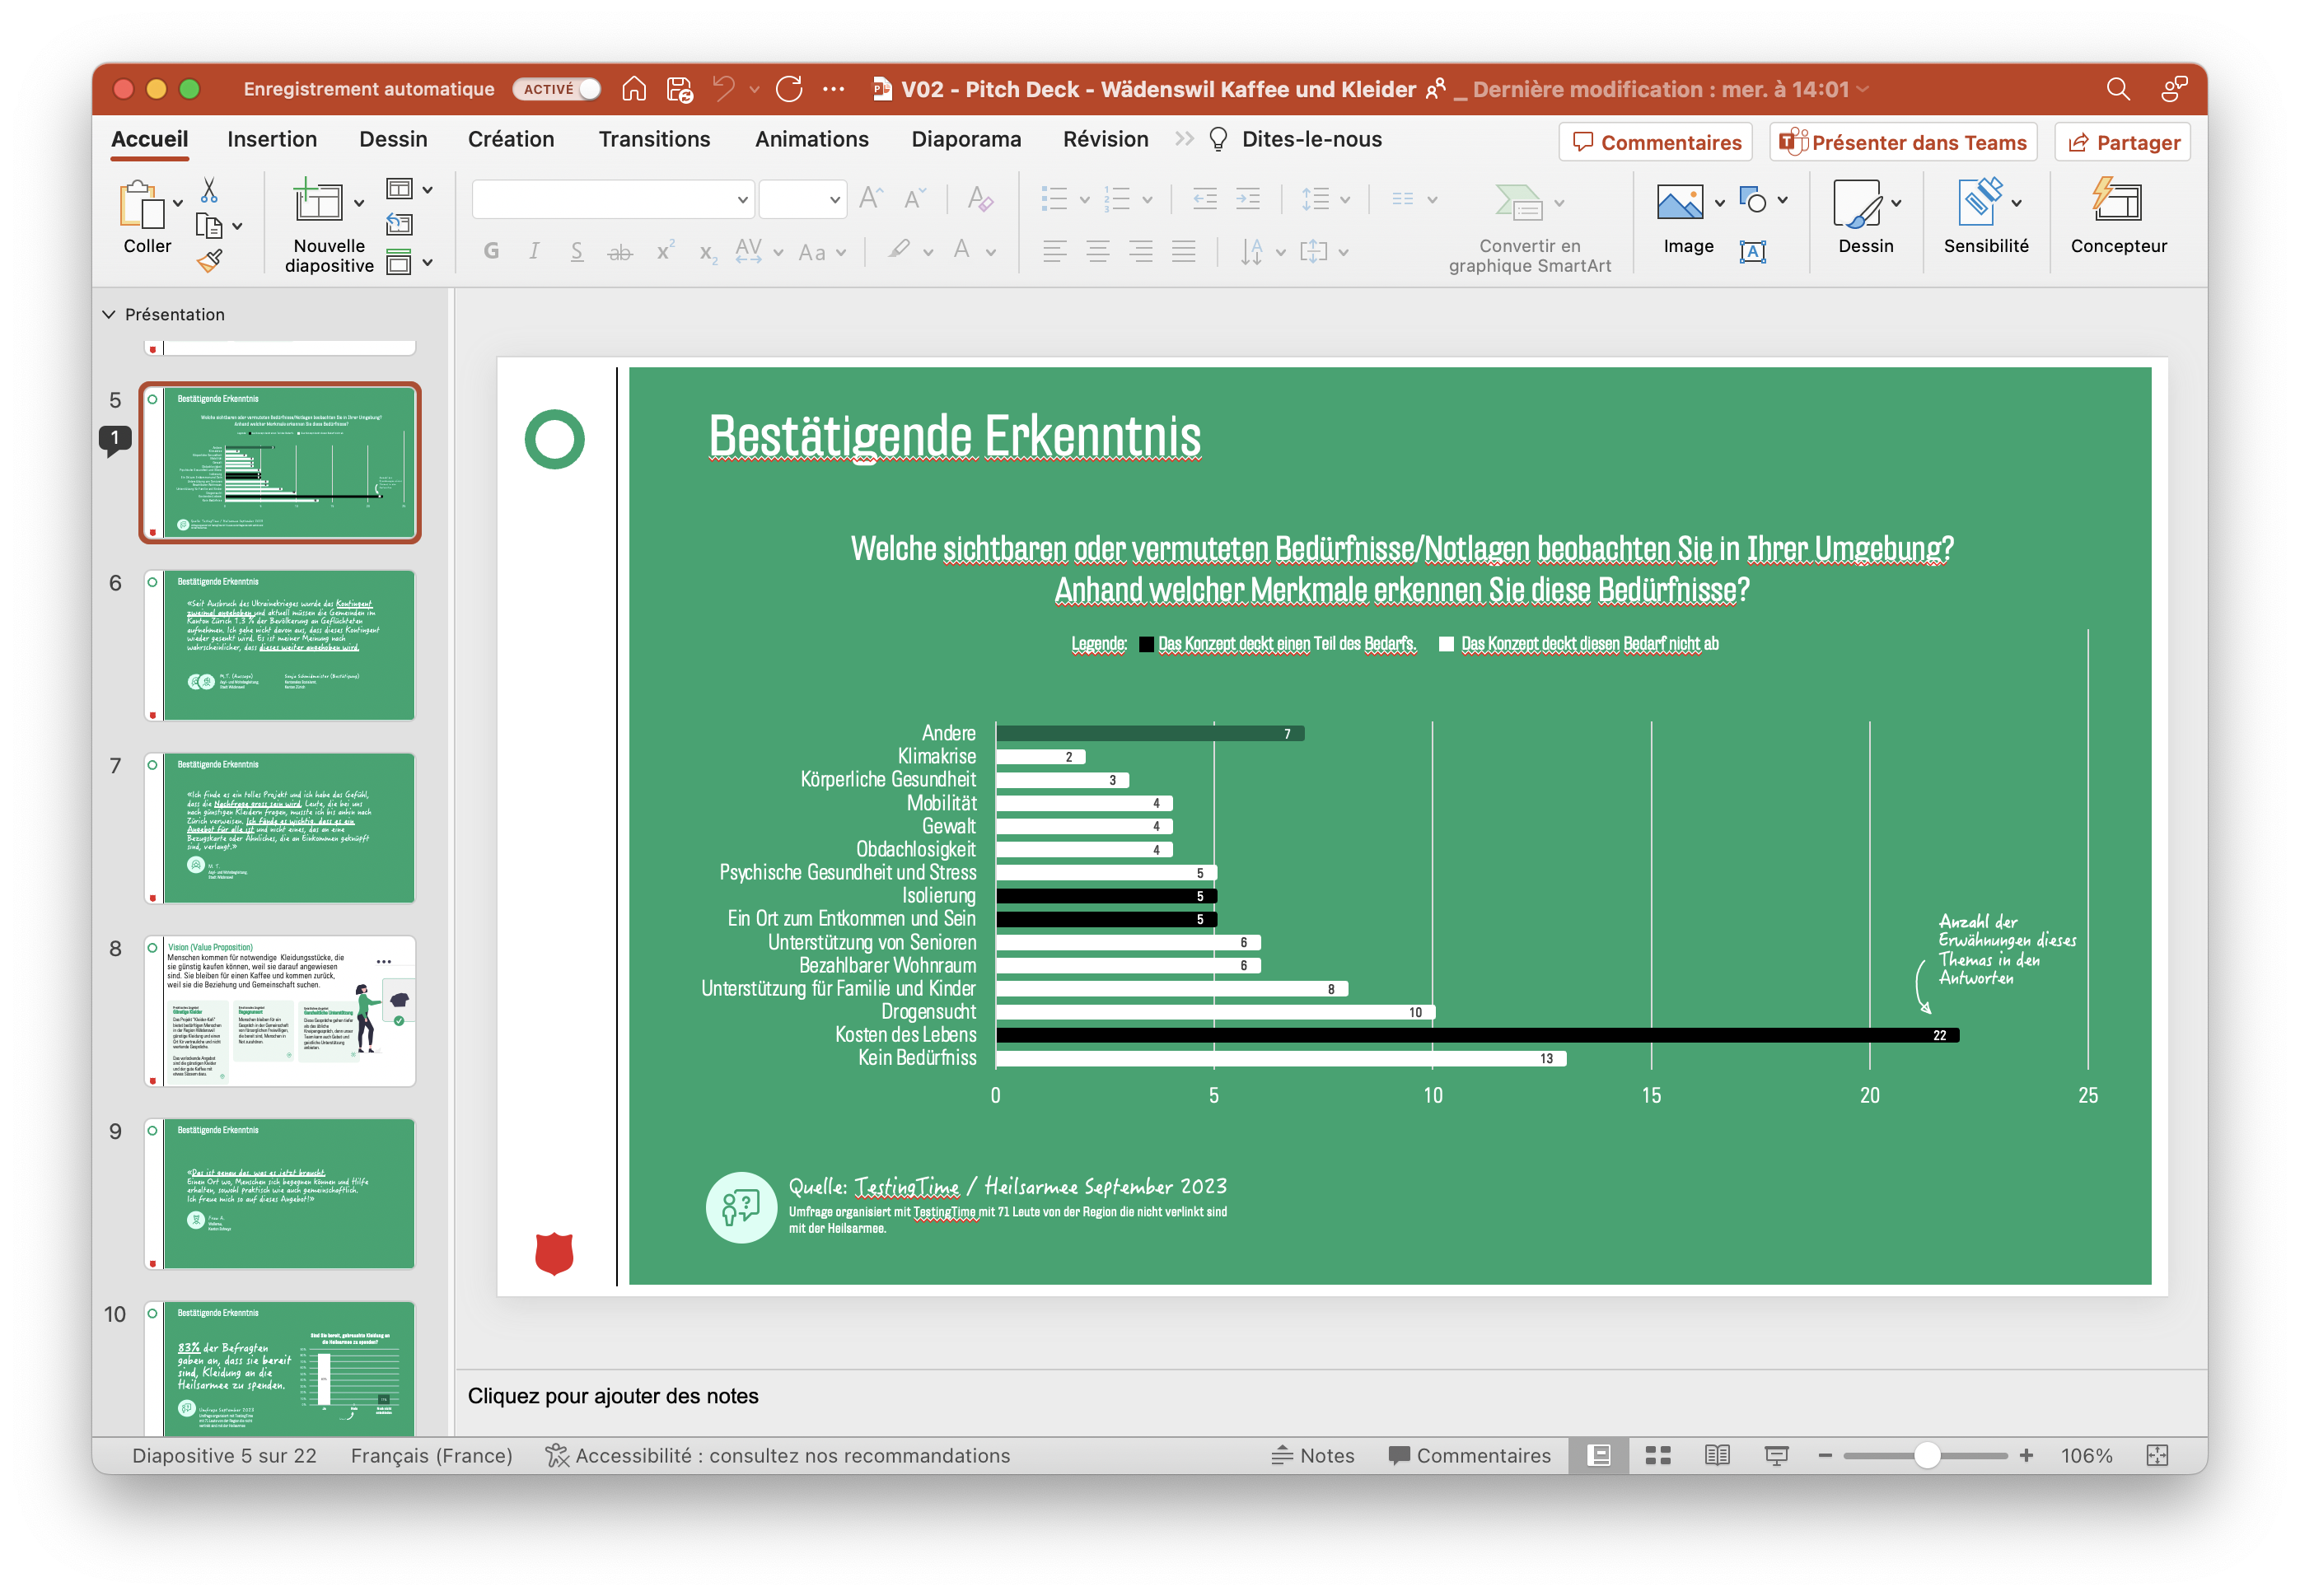
Now I can easily transform this qualitative data into something that speaks to the "excel-thinking-brain" decision-makers. This can be easily done in PowerPoint by adding a graph and playing a bit with the layout options.
How to make it even better: number + story
In the future, I'd like to go further and not only show the graph and numbered data but complement it with quotes from the answers of the people who participated in the survey.
Why I like this approach
By doing so both the story lovers and the data nerds get something that speaks to them. And it also reveals that there are people behind the numbers with more complex stories.